What is P/F Ratio?
How do we calculate Fee for a DApp?
How do we calculate Fee for a Blockchain Protocol?
What are the Similarities in P/F ratio and P/E ratio for stock valuation?
Conclusion

Recently, the Price to Fees ratio (P/F ratio) has become one of the key valuation metrics for evaluating a crypto’s fundamentals. With over 10 million different cryptos, most promising similar use cases, on-chain metrics have become the key valuation criteria for fundamental analysis to filter the spam and scam from strongly adopted cryptos.
P/F ratio is calculated as the market capitalisation (circulating or fully diluted) divided by the annualised fee of the blockchain or DApp. Annualised fee is the total fee collected in the last year by the validators of the network or the DApp by the users of the blockchain or DApp. In case the DApp or blockchain is newer (<1 year), annualised fee is often calculated as [ last 30 day fee x 12 ].
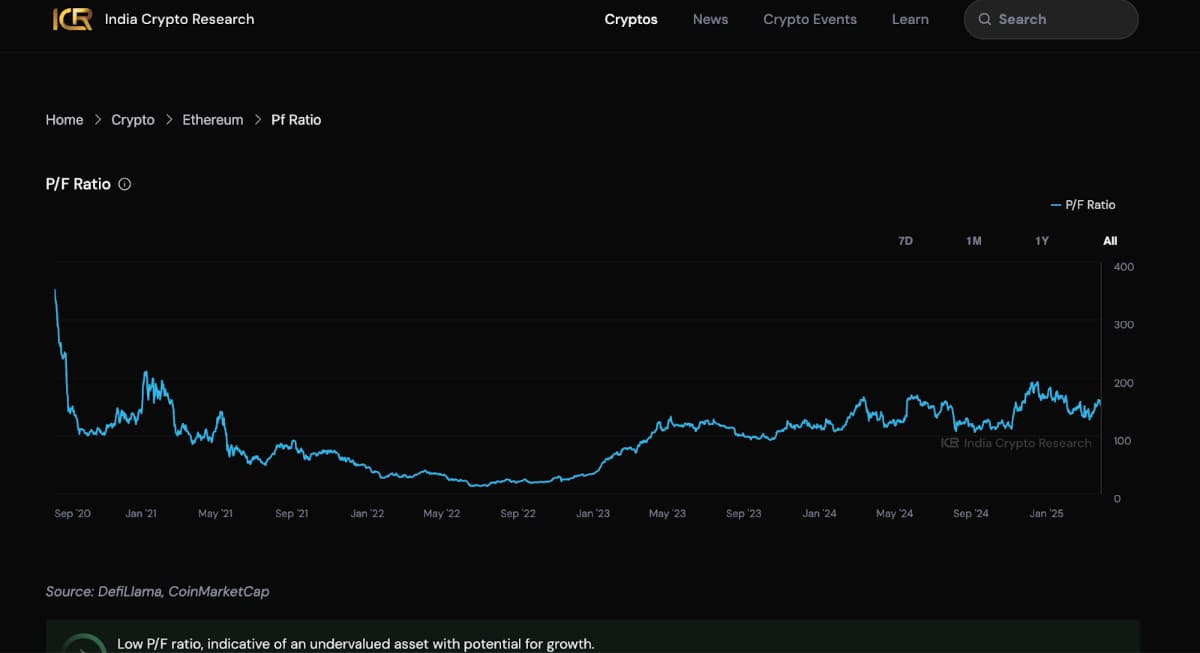
For example, Ethereum has a market capitalisation of $220bn at the time of writing this article (31 March, 2025) and its annualised fee is $1.5bn. Hence its P/F ratio is 220/1.5 ~ 147.
A DApp could be a DEX such as Uniswap, a DeFi Lending and Borrowing Platform such as AAVE or a Liquid Staking platform such as Lido, each having their own tokens. Such platforms usually have Governance (Holders can vote for roadmaps and decision making of the DApp) as the main use case of their tokens. This means their token simply serves as a DAO token and does not contribute much to the revenue or fees of the platform.
Hence, we calculate the fees or revenue generated by the DApp by calculating the commissions they made during every transaction by the users in their smart contracts.
A DEX will charge a percentage commission for every swap made, a DeFi platform will charge an interest for lending funds and a liquid staking platform will charge a percentage of the total staking rewards when redeemed. The beauty of blockchain makes all this data public in real time through which we can gauge its adoption in depth.
Every Blockchain protocol (L1,L2,L3) charges a transaction fee for every transaction made by its users. This transaction fee is distributed to the miners or validators who in turn contribute in keeping the network secure and run nodes to keep the blockchain up 24x7.
The Price-to-Fees (P/F) ratio in cryptocurrency valuation shares conceptual similarities with the Price-to-Earnings (P/E) ratio used in stock valuation. Both metrics aim to provide insights into whether an asset is overvalued or undervalued relative to its ability to generate revenue or earnings. Below are some similarities
The P/E ratio uses earnings (profits after expenses) as its denominator, while the P/F ratio uses annualised fees (transaction fees collected by validators or commissions earned by DApps). In both cases, these metrics serve as proxies for the financial health and adoption of the asset.
Along with active addresses, TVL and total token holders (including HHI distribution), P/F ratio has become one of the most important metrics tracked during fundamental analysis of crypto currencies. While not every token has the same purpose the overall business model around the token must be extremely solid for the token to survive amongst the immense competition.
Investing without proper fundamental analysis will lead you into getting stuck among regular pumps and dumps and rug pulls that happen in the crypto space. Check out in-depth analysis of various tokens on our site.
India Crypto Research operates independently. The information presented herein is intended solely for educational and informational purposes and should not be construed as financial advice. Before making any financial decisions, it's essential to undertake your own thorough research and analysis. If you're uncertain about any financial matters, we strongly recommend seeking guidance from an impartial financial advisor.