
What Did Everyone Actually Pay for Their Bitcoin?
MVRV Turns That Cost Into One Simple Number
Why Paper Profits Move Markets
Four Zones That Show Where the Cycle Stands
Five Times Bitcoin Fell Below Cost, and What Came Next
What We Did, in the Simplest Words
How Far It Fell, How Far It Ran
The Tops Keep Falling, the Floors Keep Rising
Where Bitcoin Stands Right Now
Five Other Ways to Read the Same Signal
Where MVRV Can Mislead You
What Indian Investors Should Watch Next

MVRV compares Bitcoin’s market value with what its holders paid. Above 1, the average holder is in profit. Below 1, the average holder is at a loss.
Bitcoin has traded below its realized price, the average holder’s cost, only five times since 2011. Each episode ended in a rally of at least 4x.
Those dips are getting shallower, from 61% below realized price in 2011 to only 25% below it in 2022.
MVRV’s cycle peaks have fallen every cycle, from 7.7 in 2011 to 2.8 in 2024, so the old “sell above 3.5” rule did not trigger this cycle.
On 15 November 2026, CryptoQuant analyst Darkfost reported that MVRV had slipped below 1.2. Holders are still in profit on average, but only just.

 Part of a series
On 6 October 2025, Bitcoin closed at a record of about $124,800. By 13 November 2026, it was trading at about $68,000. Is that cheap? Price alone can’t answer that, because “cheap” depends on what people paid. The MVRV ratio measures exactly that.
Imagine a housing society of 100 flats. Some owners bought in 2005 for ₹20 lakh, some in 2015 for ₹60 lakh, and some last year for ₹1.2 crore. Average what each current owner paid and you get the society’s average cost, say ₹70 lakh. If flats now sell for ₹1 crore, most owners are in profit, but last year’s buyers are at a loss.
Bitcoin’s blockchain makes the same calculation possible for every coin. It doesn’t keep account balances. Instead, it keeps chunks of coins called UTXOs (Unspent Transaction Outputs), which work like individual rupee notes in a wallet. Each chunk records when it last moved. A coin usually moves when someone buys or sells it, so its price on that day is a good estimate of what the current owner paid.
Realized cap (realized capitalisation) values every coin at the price on the day it last moved, then adds them all up. Nic Carter and Antoine Le Calvez introduced the idea in September 2018, and Coin Metrics published the data. Divide realized cap by the number of coins and you get the realized price, the average cost of one bitcoin across all holders.
MVRV stands for Market Value to Realized Value. Murad Mahmudov and David Puell introduced it on 2 October 2018.
MVRV = Market Cap ÷ Realized Cap, which is the same as Price ÷ Realized Price
The infographic below walks through a three-coin example. Today’s value is $300,000 and holders paid $180,000, so MVRV is 1.67.
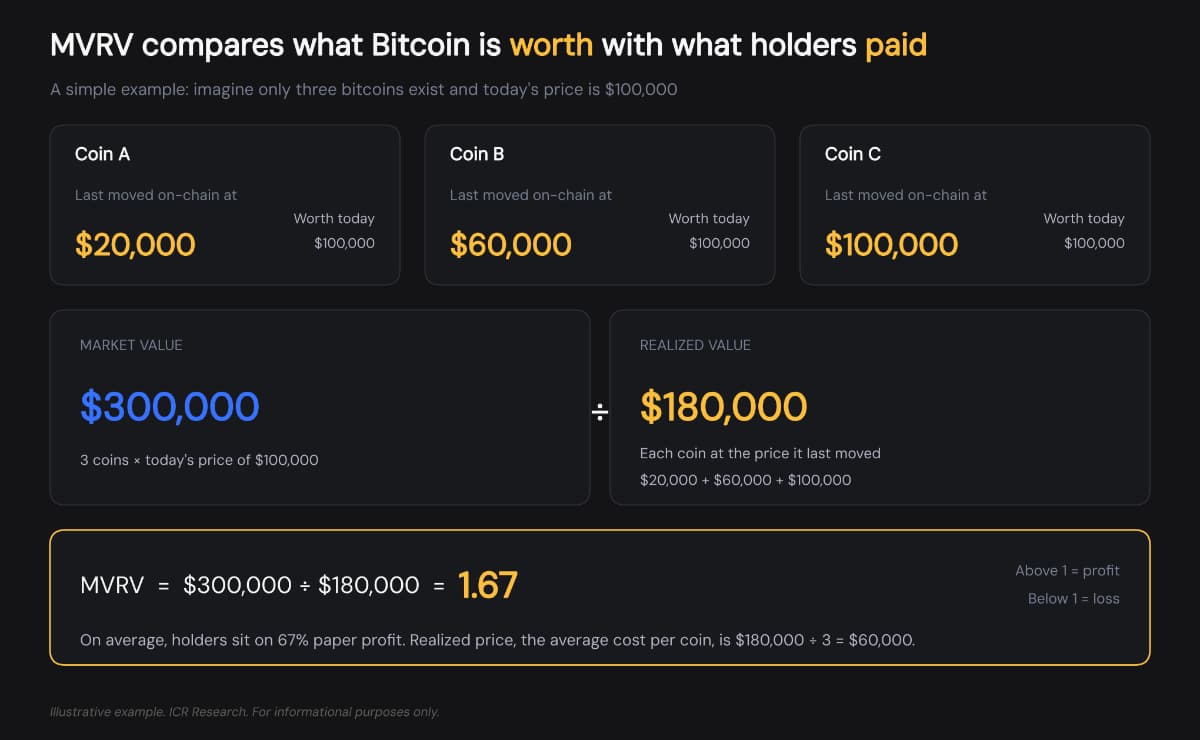
An MVRV of 1.67 means holders, on average, are sitting on 67% unrealized profit, meaning profit on paper that they haven’t booked yet.
Price tells you what the market will pay today. MVRV tells you how the people already holding feel about that price, and their mood drives selling.
When MVRV is high, holders are sitting on large paper profits, and the temptation to sell grows. When MVRV falls below 1, the average holder is underwater. Weak hands sell in panic, a phase called capitulation, and the coins pass to buyers willing to hold for years. MVRV turns that crowd psychology into one number, built from blockchain records rather than opinion surveys.
Analysts read MVRV in four broad zones. The scale below marks where past cycle lows and peaks landed, and where Bitcoin sits now.
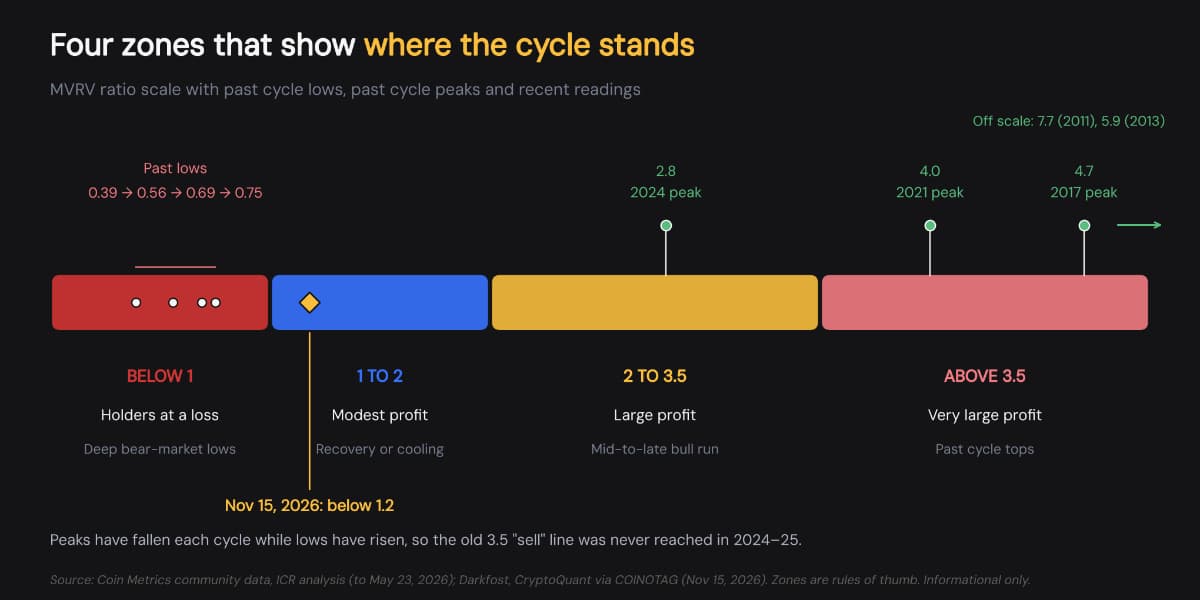
These zones are rules of thumb taken from past cycles, not laws. As the next sections show, the top zone has already stopped working.
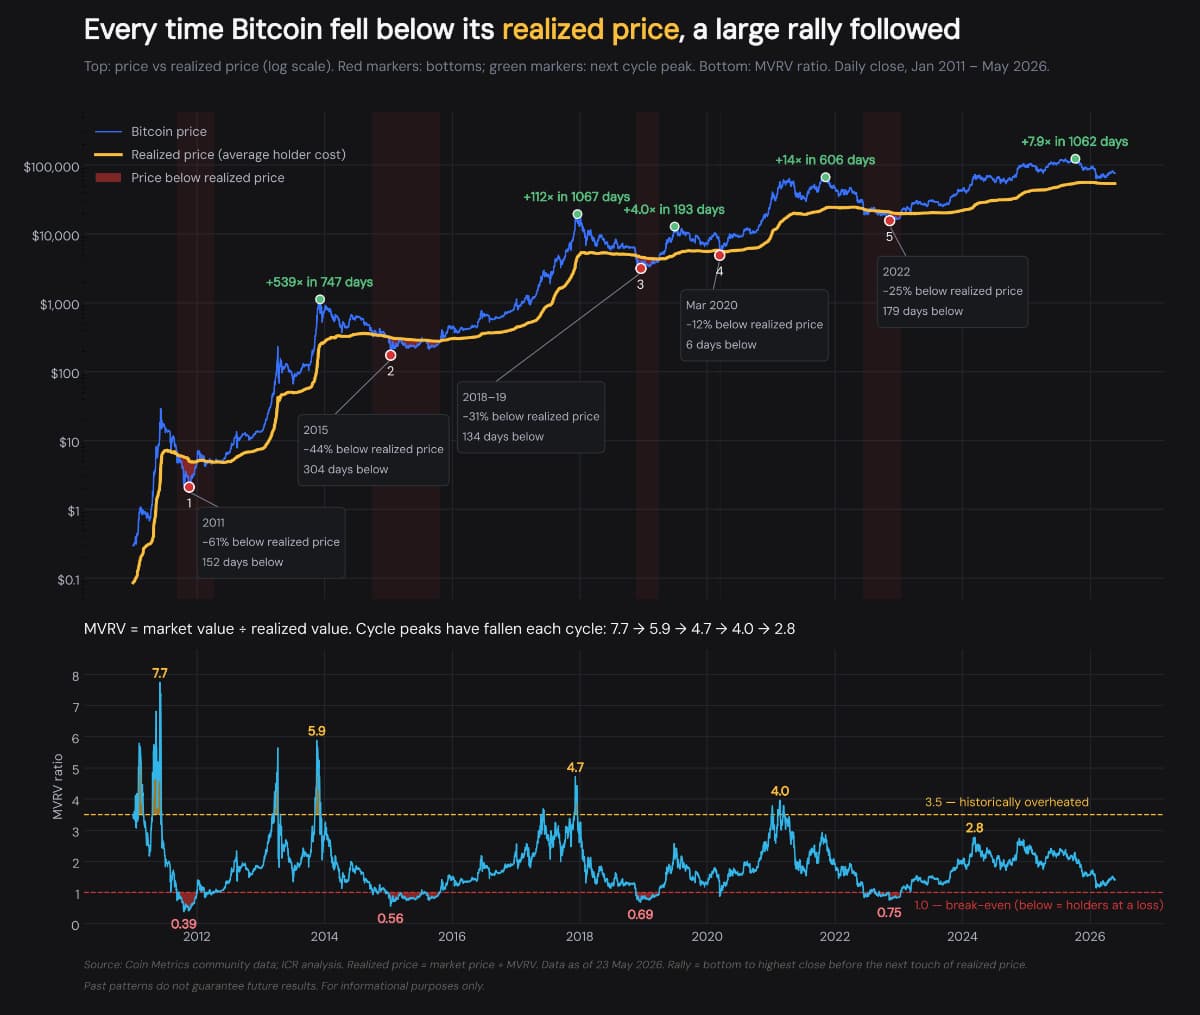
Using Coin Metrics daily data from January 2011 to May 2026, ICR found five episodes in which Bitcoin closed below its realized price. Dips back above realized price that lasted under 60 days were treated as part of the same episode. The chart marks each one.
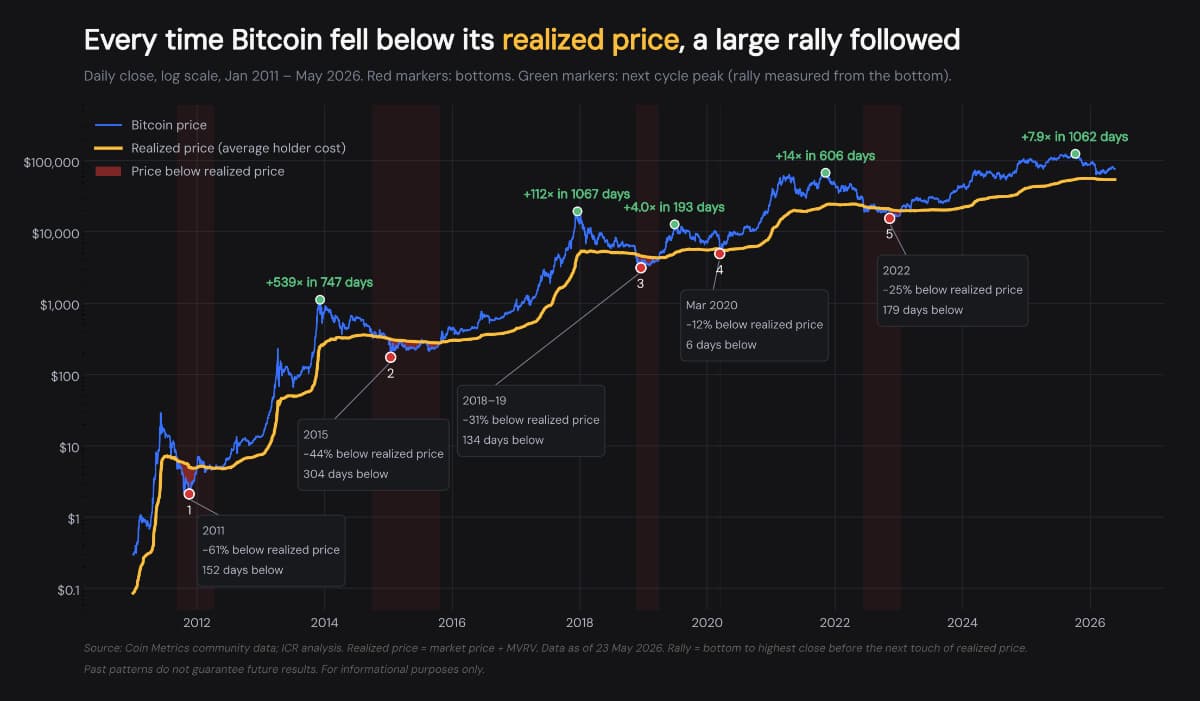
Episode | Bottom (daily close) | Deepest below realized price | Days below | Rally to next peak |
|---|---|---|---|---|
2011 | $2.11, Nov 18, 2011 | −61% | 152 | 539x in 747 days |
2014–15 | $176, Jan 14, 2015 | −44% | 304 | 112x in 1,067 days |
2018–19 | $3,185, Dec 15, 2018 | −31% | 134 | 4x in 193 days |
2020 (COVID crash) | $4,959, Mar 12, 2020 | −12% | 6 | 13.6x in 606 days |
2022 (FTX collapse) | $15,758, Nov 9, 2022 | −25% | 179 | 7.9x in 1,062 days |
Rally is measured from the bottom to the highest close before the next touch of realized price. The 2018–19 rally was cut short by the March 2020 crash. Measured instead to the November 2021 top, it was about 21x.
Touching realized price was a warning, not the bottom. Most lows came 26 to 149 days after the first touch, and the stay below lasted anywhere from six days to ten months. Put side by side, the episodes show a clear trend.
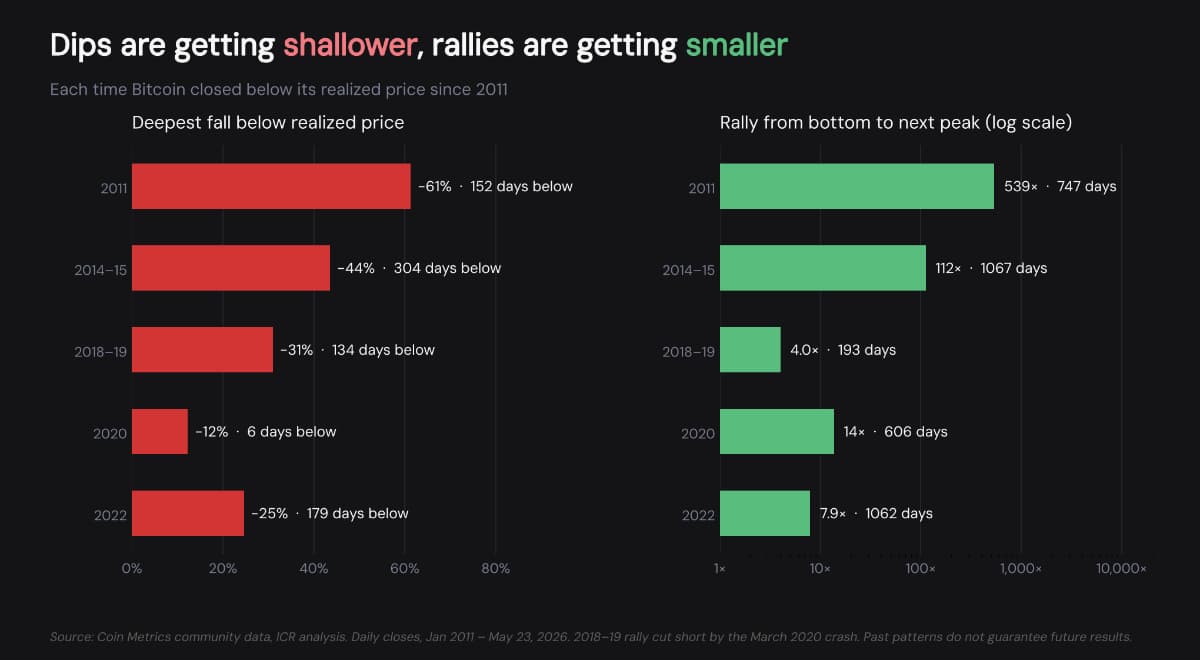
Each dip has been shallower and each rally smaller than the cycle before, which fits a market that is growing up. A 539x rally from a $2 bitcoin is not going to repeat at $68,000.
Think of the realized price as a line drawn on a wall. It marks what everyone paid for their bitcoin, on average.
We went back over 15 years of Bitcoin’s price. Every time the price slipped under that line, we asked four simple questions:
1. How long did the price stay under the line?
2. How far down did it go, and how many days did that take?
3. Once it stopped falling, how far up did it climb, and how many days did that take?
4. How big was the climb compared with the fall?
The last question is what the charts call reward-to-risk. Picture a ball that rolls down 1 step and then bounces up 10 steps. The bounce was 10 times bigger than the drop, so the ratio is 10 to 1. That’s all it means.
The price slipped under the line five times. Each time, the fall came first and the climb came later, and the climb turned out bigger than the fall. But each climb was smaller than the one before, and five examples is not many. It’s like noticing that it rained on your last five birthdays. That’s interesting, but it doesn’t promise rain on the next one.
So treat what follows as a history lesson, not a plan. It shows what happened before. It doesn’t say what will happen next, and it isn’t a suggestion to buy or sell anything.
The chart below measures the fall from realized price to the bottom (the risk), the rally from the bottom to the next top (the reward), and the ratio between them, with averages across all five episodes.
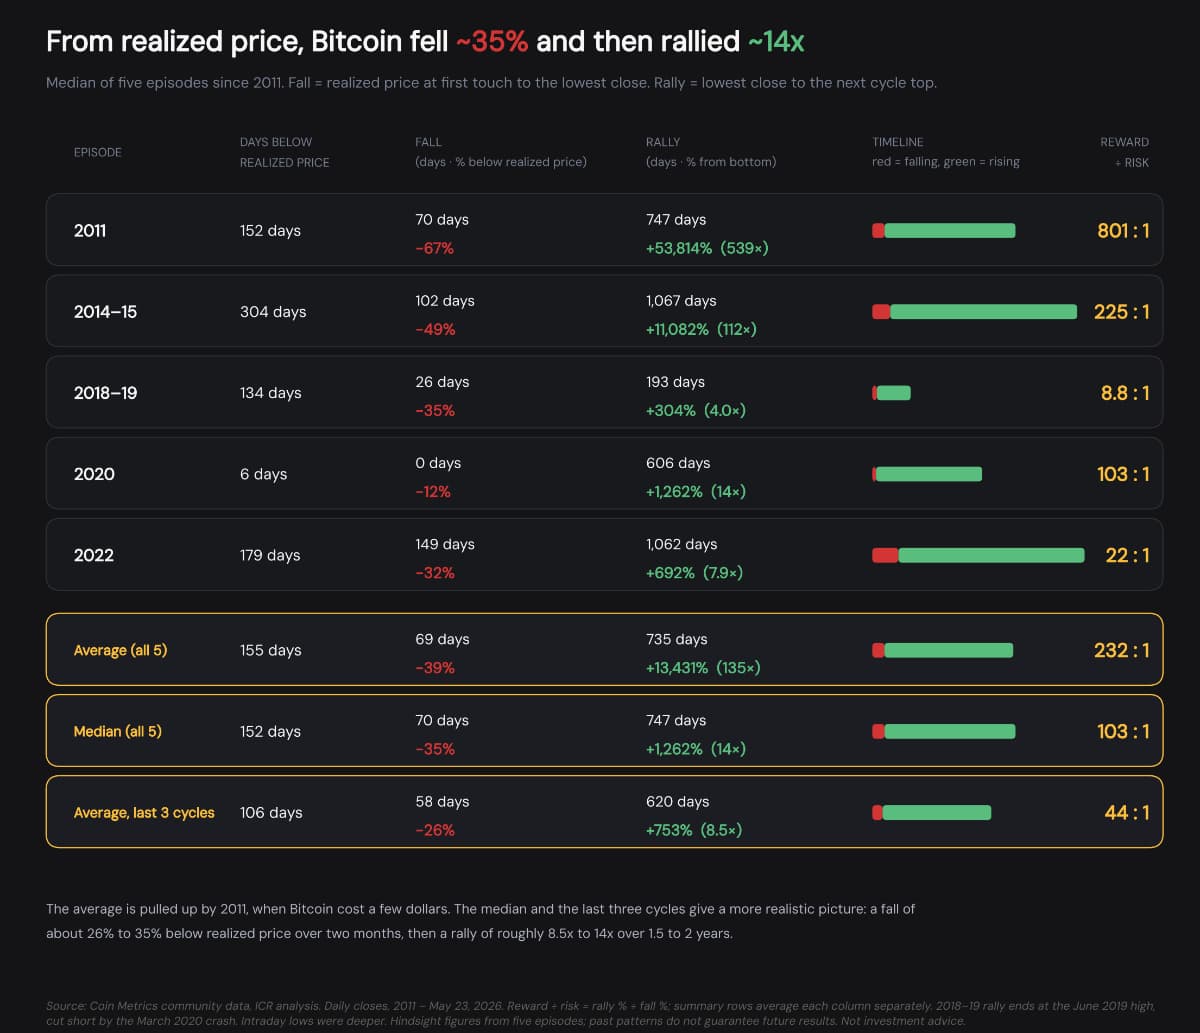
The simple average is distorted by 2011, when Bitcoin cost a few dollars, so the median is more useful. A typical episode fell about 35% below realized price over 70 days, then rallied about 14x over roughly two years, a reward-to-risk of about 103:1. Over the last three cycles, the numbers shrink to a 26% fall, an 8.5x rally and about 44:1. These are hindsight figures, since no one knows the bottom or the top in advance.
The next chart adds the actual prices at each turning point, along with the return from the bottom and from the realized price itself.
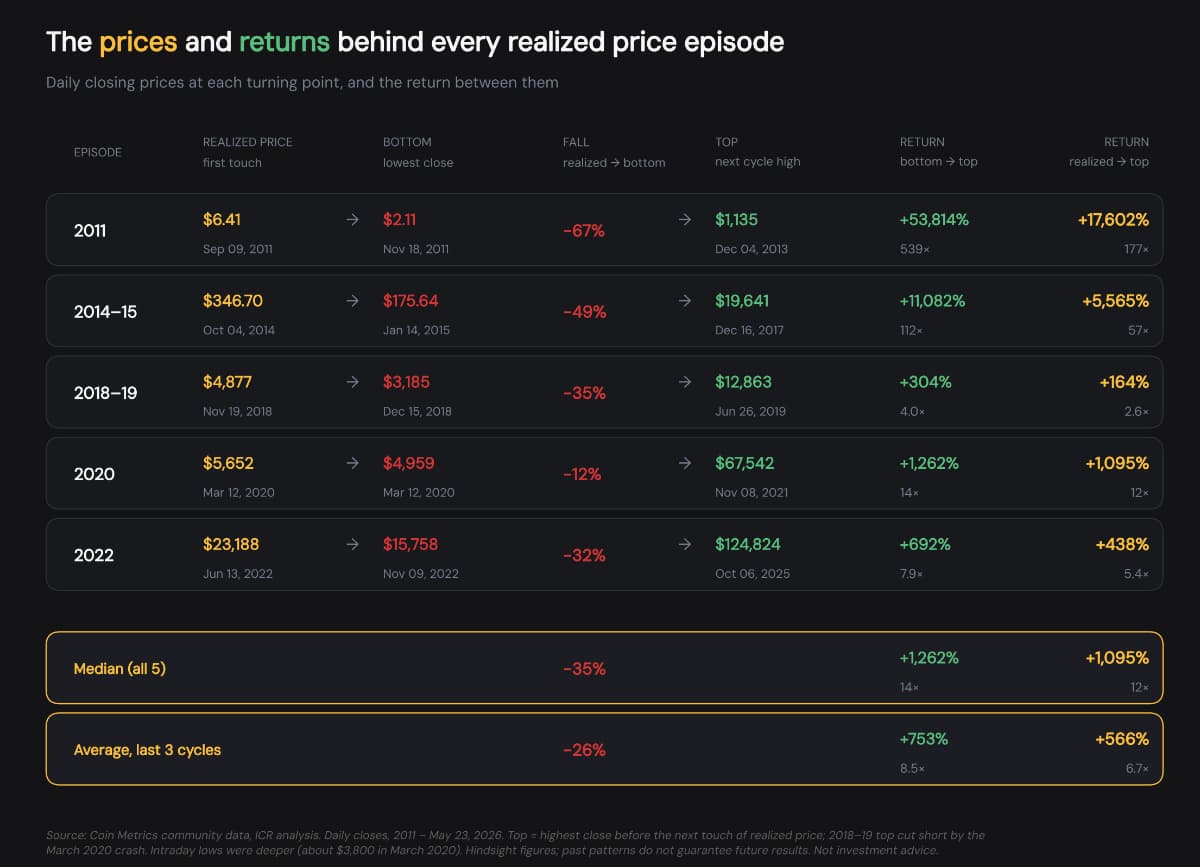
Measured from the realized price instead of the bottom, the median rise to the next top was 1,095% (12x). Over the last three cycles, it averaged 566% (6.7x). Like every number here, this describes the past and is not a forecast.
Add the MVRV ratio under the price chart, and the same story appears in a single line.
Pull out just the highest and lowest reading of each cycle, and the squeeze is plain to see.
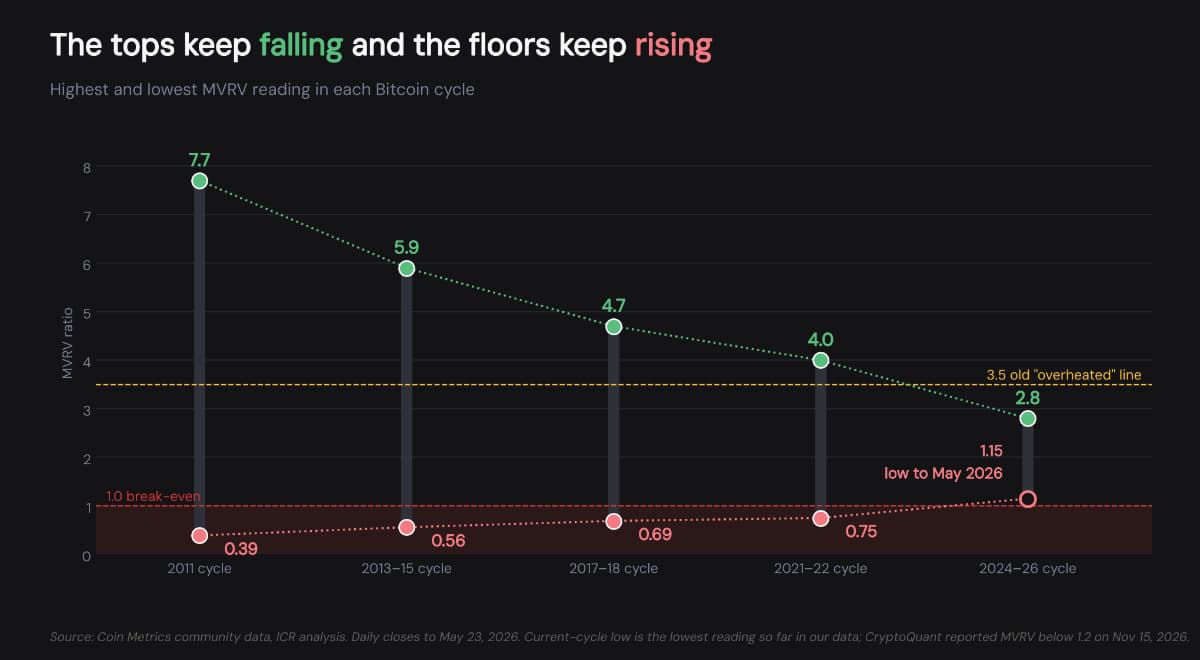
Across cycles, peaks fell from 7.7 to 5.9, 4.7, 4.0 and 2.8, while lows rose from 0.39 to 0.56, 0.69 and 0.75. Mahmudov and Puell saw this coming: their original 2018 paper warned that the upper threshold might become less reliable as Bitcoin grew less volatile. That is what happened. Bitcoin’s 2025 record came with MVRV below 3, so anyone waiting for 3.5 never got a sell signal.
Our data ends in May, when MVRV read 1.41, and the market has cooled sharply since then. Four numbers sum up mid-November.
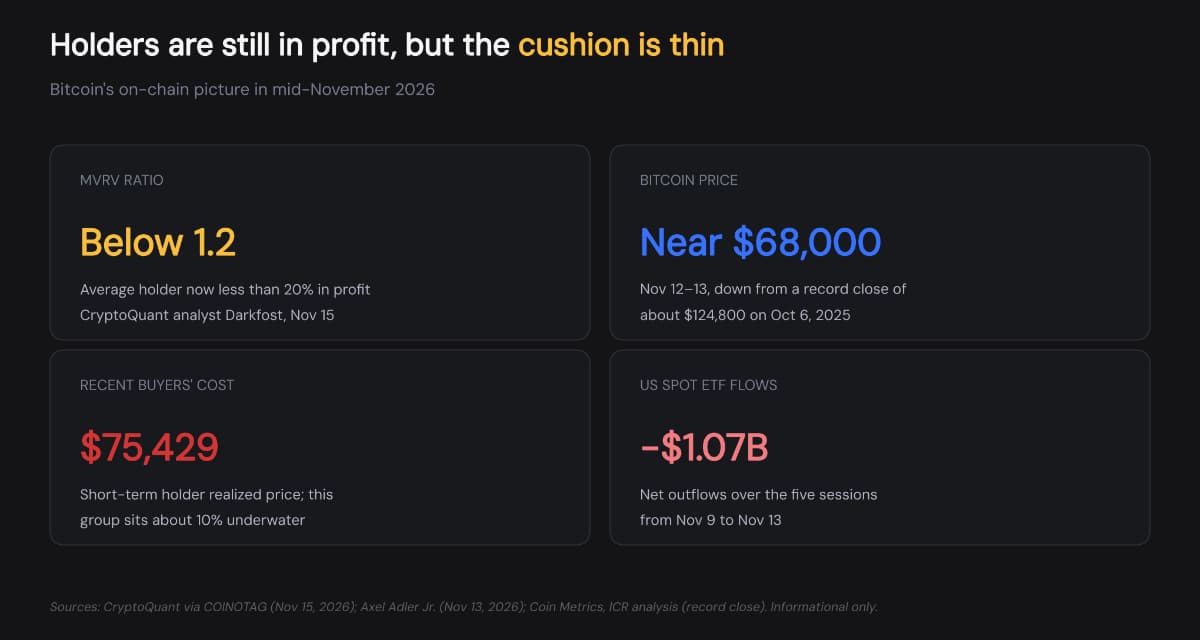
CryptoQuant analyst Darkfost’s 15 November reading below 1.2 was the third such alert of 2026. US spot Bitcoin ETFs (exchange-traded funds that hold real bitcoin) saw about $1.07 billion in net outflows from 9 to 13 November. Recent buyers are taking the biggest hit. On-chain analyst Axel Adler Jr. reported that the price sat below the short-term holder realized price of $75,429 for five straight days, leaving that group about 10% underwater.
The price still hasn’t touched the overall realized price, which LookIntoBitcoin put near $53,000 in July. The firm argued that rising MVRV lows mean the next major low could arrive before the price ever reaches realized price. If that holds, waiting for MVRV to drop below 1 could mean missing the bottom.
MVRV isn’t the only tool built on holders’ cost. The closest alternative is NUPL, which carries the same information on a different scale.
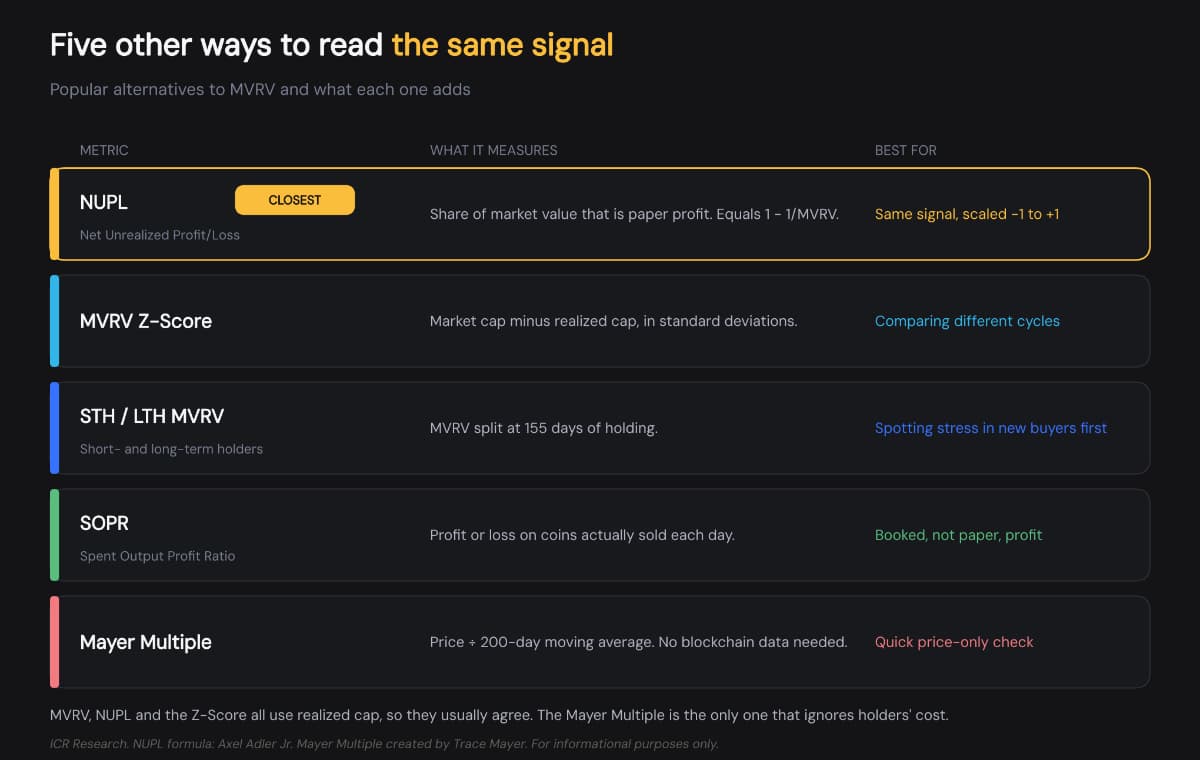
• NUPL (Net Unrealized Profit/Loss) equals 1 − 1/MVRV. An MVRV of 1.2 is a NUPL of about 0.17, meaning 17% of Bitcoin’s market value is paper profit.
• MVRV Z-Score, created by the analyst Awe and Wonder a week after MVRV, makes readings easier to compare across cycles.
• Short-term holder MVRV usually turns first, because recent buyers react fastest.
• SOPR shows booked profit rather than paper profit. ICR covered it in an earlier article.
• Mayer Multiple needs only price, so it works even without blockchain data, but it says nothing about holders’ cost.
• Lost coins. Coins untouched since 2010 to 2012, many probably lost forever, still count at their tiny old prices. They pull realized price down and push MVRV up slightly.
• Internal transfers. When an exchange or custodian moves coins between its own wallets, the cost basis resets even though nobody sold.
• ETFs. Investors who trade ETF shares move no coins, so much of their buying and selling never reaches the blockchain.
• Small sample. Five episodes are not enough to treat any threshold as a rule.
MVRV doesn’t predict the next price. It shows how stretched the market is compared with what holders paid, so read it alongside other measures:
• MVRV near 1. A drop below 1 has marked every past bear-market low, though this cycle may bottom above it.
• Short-term holder realized price. A sustained move back above $75,429 would suggest recent buyers have stopped selling at a loss.
• ETF flows. These capture demand that on-chain metrics miss.
Indian investors also face a tax cost that MVRV doesn’t show. Gains on VDAs (Virtual Digital Assets, the Indian legal term for crypto, tokens and NFTs) are taxed at a flat 30% plus 4% cess. This rule moved from Section 115BBH of the 1961 Act into the Income-tax Act, 2025, effective 1 April 2026. A loss on one coin cannot reduce tax on a gain from another. Exchanges also deduct 1% TDS (tax deducted at source, withheld automatically on each sale) above yearly limits. So a paper profit is worth less after tax than MVRV suggests, and a realized loss brings no tax relief.
Sources: Coin Metrics community data and ICR analysis, Mahmudov and Puell (October 2018), Glassnode, Bitcoin Magazine, COINOTAG (15 Nov 2026), Axel Adler Jr. (13 Nov 2026) and LookIntoBitcoin (10 Jul 2026).
India Crypto Research operates independently. The information presented herein is intended solely for educational and informational purposes and should not be construed as financial advice. Before making any financial decisions, it's essential to undertake your own thorough research and analysis. If you're uncertain about any financial matters, we strongly recommend seeking guidance from an impartial financial advisor.


