
This week in one minute
How far has this actually fallen?
Who was actually selling?
The funds did not stop
Miners switched off
What are traders paying for protection?
Leverage never cleared
Washington set the tone
Where are the key levels?
What this means for Indian readers

Bitcoin closed at $65,305 (about ₹61 lakh), down 12.4%, its sixth losing week in a row and the worst of them.
Long-term holders sold 71,000 coins, the largest weekly distribution in our records.
Just 51.8% of all Bitcoin is now in profit. In early October it was 79%.
Spot ETFs sold $1.07 billion, with an outflow on every one of the five trading days.
Miners have switched off 17% of the network since late October, and mining difficulty fell 9.13%.

 Part of a series
For six weeks, this market ground lower while the people who own it sat on their hands. That has changed. Bitcoin fell 12.4% this week to $65,305 and touched $62,018. For the first time in this series, the long-term holders, the wallets that sat through the whole rally, became the sellers.
We have missed a few issues, so this one covers where the market has arrived rather than one week alone. We have filled in the tracker back to late October, and that longer view is what makes this week make sense.
1. Price fell 12.4% to $65,305. That is 24% below the early October close and roughly 48% under the October 2025 record.
2. Long-term holders sold 71,000 coins. Short-term holders picked up almost exactly that amount.
3. Barely half of supply is in profit. It’s 51.8%, down from 58.4% a week ago.
4. Miners pulled the plug. Hash rate fell 11.8% in a week, and difficulty dropped 9.13%.
5. Washington set the tone. The two-year Treasury yield jumped 37 basis points on Fed hike expectations.
Price is now below every cost basis we track.
Three numbers mark where different groups of owners break even. The True Market Mean, the average price paid by investors who are still active, is $79,039. The short-term holder cost basis, what buyers of the last five months paid on average, is $75,703. The Realised Price, the average cost of every coin in existence, is $53,652.
Bitcoin closed at $65,305. That’s 17% below the True Market Mean and 14% below what recent buyers paid, but still well above the all-in average. In plain terms, almost everyone who bought this year is underwater, and almost everyone who bought before this year is not.
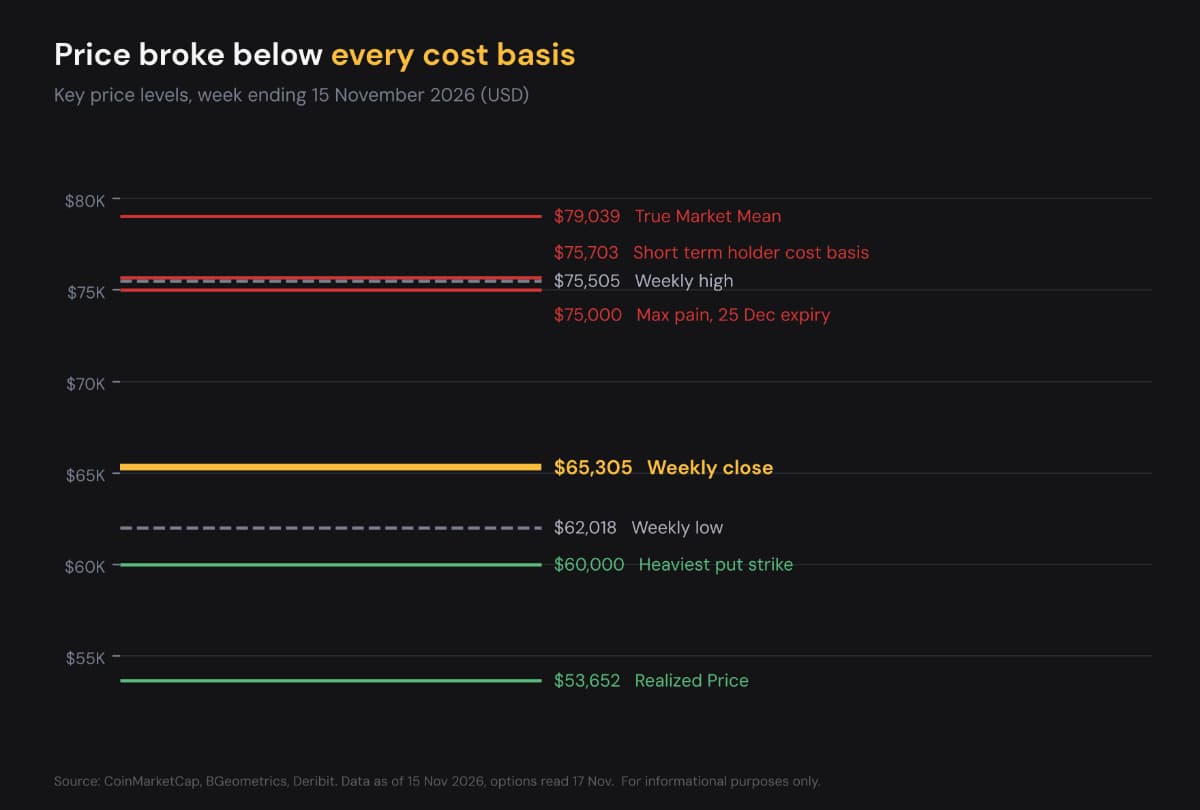
Key Bitcoin price levels for the week ending 15 November 2026
Snapshot. Weekly close $65,305, down 12.4%. High $75,505, low $62,018. Average daily volume rose 23% to $33.3 billion.
What this means for readers. The levels that acted as a floor through October are now resistance overhead. Below here, the next structural support is the heaviest block of put options at $60,000, then the Realized Price at $53,652.
The patient cohort moved 71,000 coins, a new record.
Coins that have not moved for roughly 155 days belong to long-term holders. That pool fell from 14.418 million to 14.347 million Bitcoin, and short-term holder supply rose by almost exactly the same amount. This is the first week in this series in which the patient money did the selling.
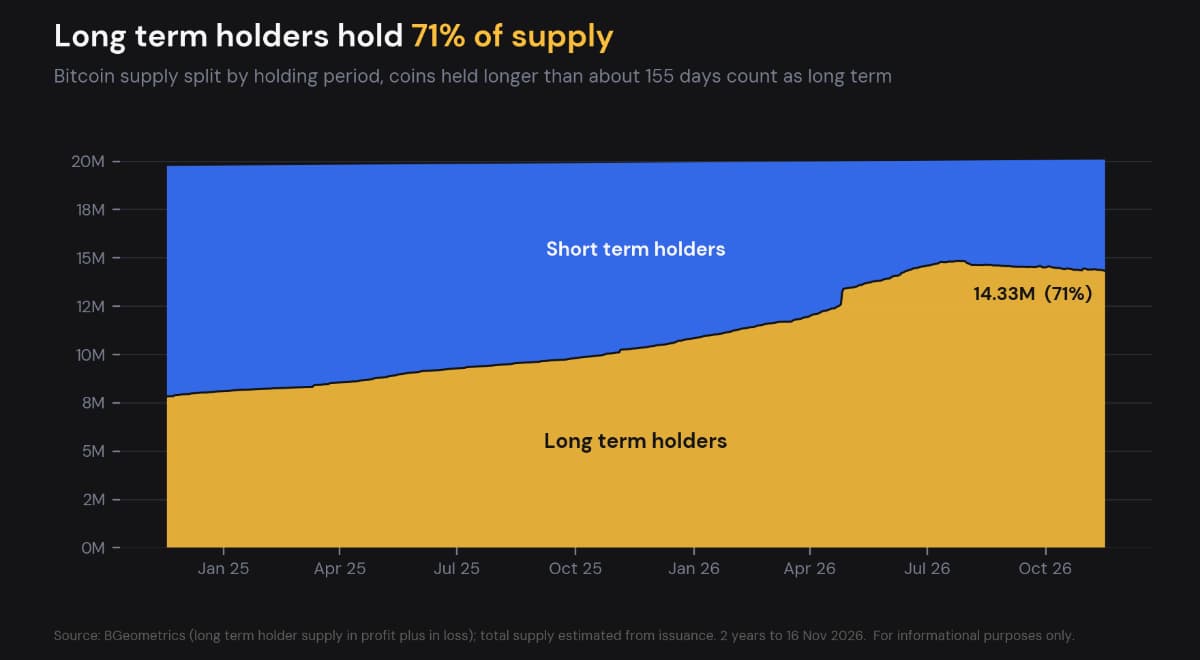
Bitcoin supply split between long-term and short-term holders
SOPR tells you whether coins being moved are sold at a profit or a loss. It is 0.9948, a second week below 1, so coins are leaving wallets at a loss. That is capitulation rather than profit-taking. Realized Cap, the money actually settled on-chain, fell $4.8 billion, so those losses are real.
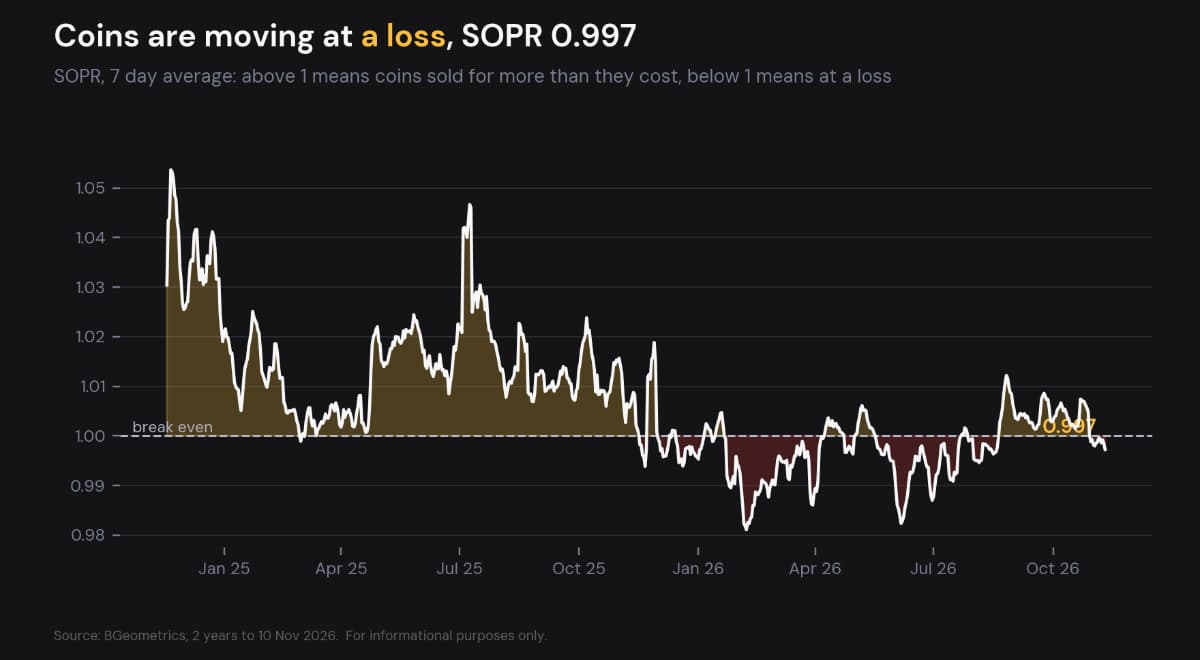
SOPR, 7-day average, showing whether coins move at a profit or a loss
The share of Bitcoin held at a profit has fallen in a near straight line, from 79% in early October to 51.8%. MVRV, which compares market value with what holders paid (realized value), is down to 1.22 from 1.55. NUPL has dropped out of optimism into what analysts call the hope and fear zone, at 0.18.
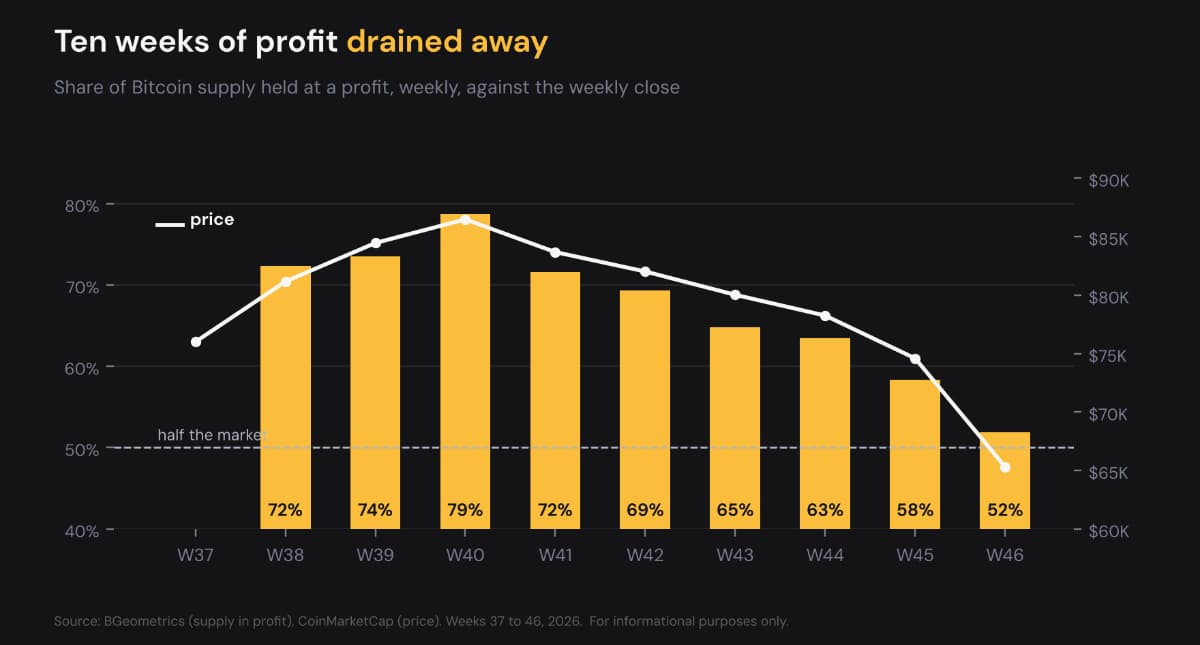
Share of Bitcoin supply held at a profit, weekly, against the weekly close
Snapshot. Long-term holder supply 14.347 million BTC, down 71,000. SOPR 0.9948. MVRV 1.22, NUPL 0.18. Supply in profit 51.8%.
What this means for readers. Long-term holders selling into weakness is what late-stage drawdowns look like, and historically it is also what exhausts the supply. But these readings are not yet at cycle-bottom levels, where MVRV falls under 1 and most of the market is underwater. Watch whether the selling continues next week or stops at one burst.
US spot ETFs sold a net $1.07 billion in the week to 13 November, with an outflow on every single trading day. BlackRock’s fund alone accounted for $908 million of that, 85% of the week, despite being the steadiest buyer of the past two years.
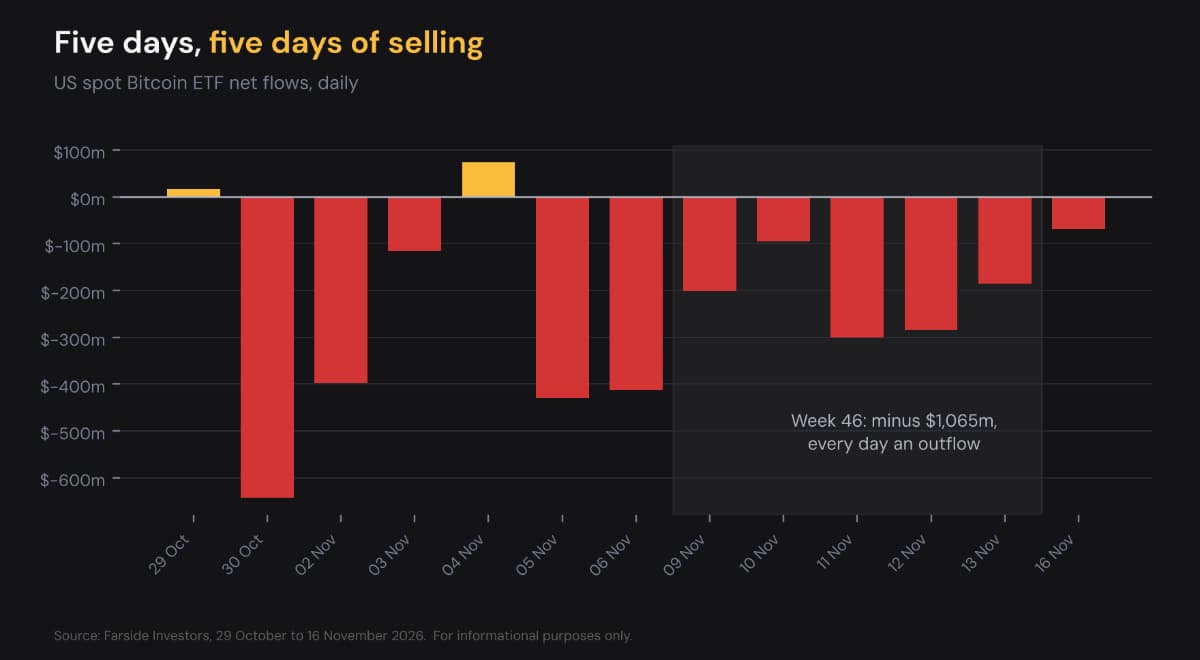
Daily US spot Bitcoin ETF net flows, late October to mid November 2026
The two weeks together come to $2.35 billion of outflows. Stablecoin supply, the cash sitting ready to buy, has shrunk every week since early October, from $312.8 billion to $288.9 billion. There is simply less money standing by to absorb the selling.
Snapshot. Spot ETF net flows minus $1,065 million. Stablecoin supply $288.9 billion, a seventh straight weekly fall.
What this means for readers. The buyer that carried this market through 2026 is now a seller, and sideline cash is shrinking. Until one of those turns around, rallies will have little behind them.
Hash rate, the computing power securing the network, peaked at 1,075 EH/s in late October and has fallen to 893.7 EH/s, a 17% drop. Difficulty adjusted down 9.13%, the largest fall in our series, and weekly miner revenue is $203.5 million, down 29% from mid October.
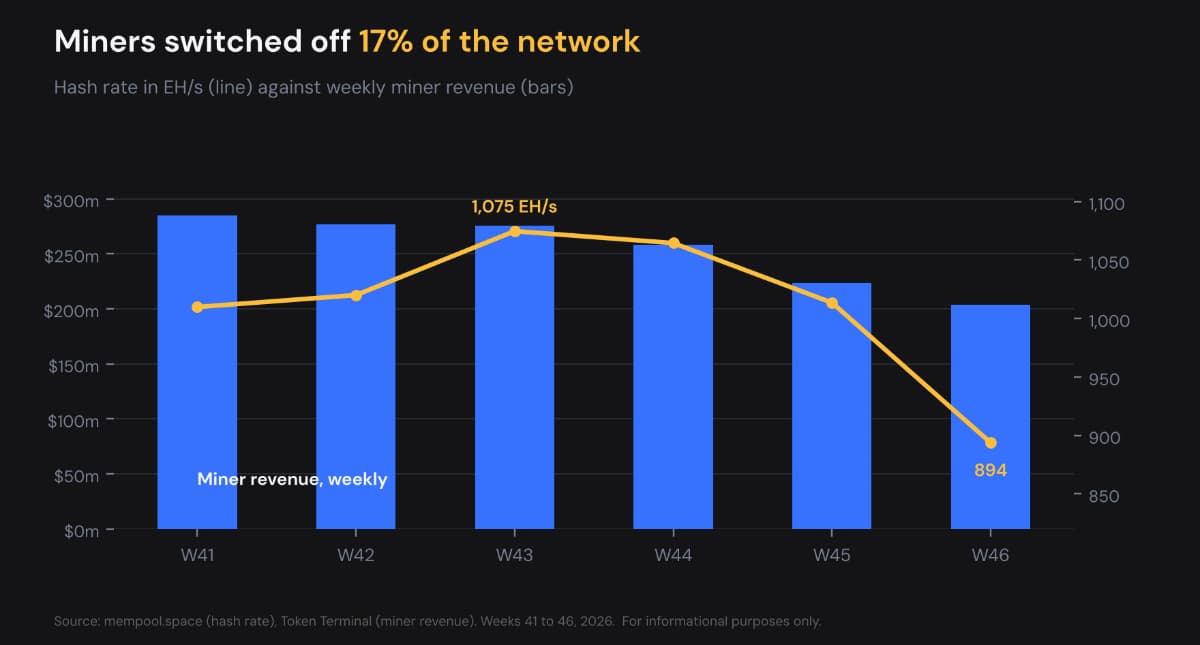
Hash rate against weekly miner revenue, weeks 41 to 46
What this means for readers. Falling difficulty is the network doing exactly what it is designed to do: making mining easier for whoever is still in the game. For the market, it signals that the highest-cost producers have stopped, which historically clusters near lows rather than highs.
The one-week skew is 5.13, the most expensive puts have been relative to calls in this series, and implied volatility is 43%, also a series high. Max pain for the December expiry is $75,000, which now sits above the market. Through September and October, it sat below.
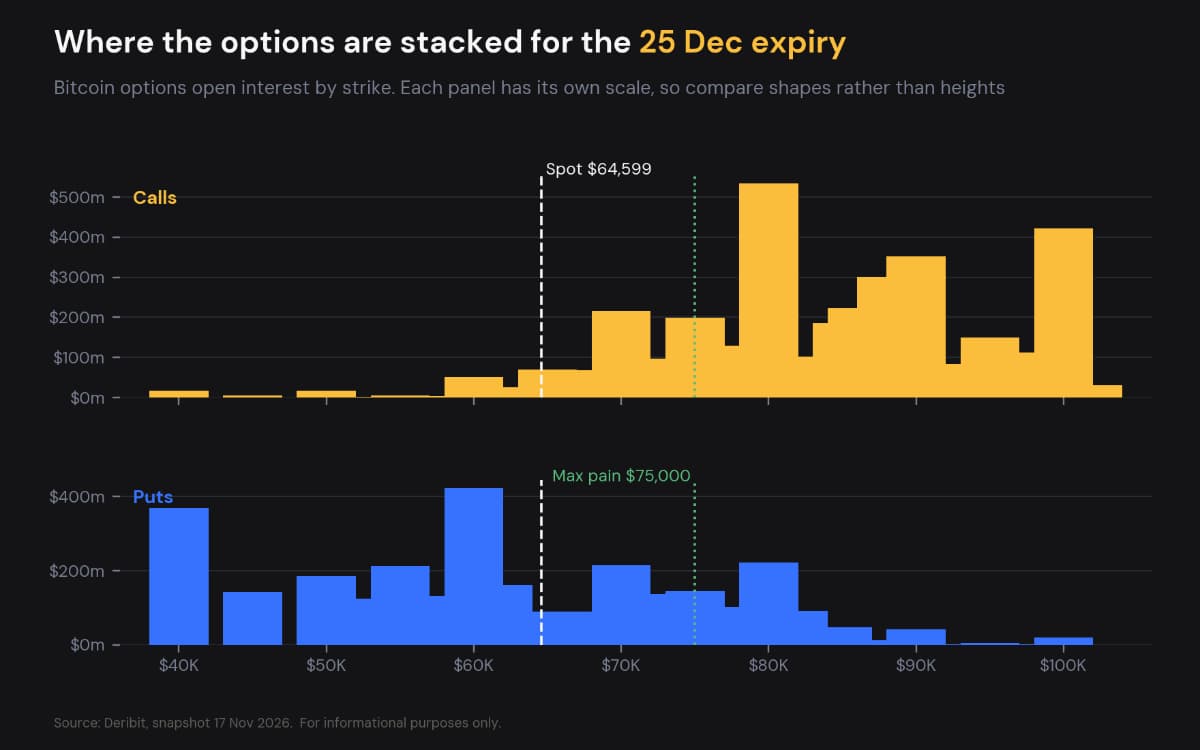
Bitcoin options open interest by strike for the December expiry
The strike map shows the shape of it. The heaviest block of puts sits around $60,000, while calls are stacked between $80,000 and $100,000, well out of reach.
What this means for readers. Protection is expensive right now, which makes this the wrong time to buy it. The useful read is positioning rather than timing: traders expect more downside than upside over the next month.
In dollars, futures open interest fell from $52.0 billion in mid October to $41.7 billion. In coins, though, it is 649,640 BTC against about 620,000 a month ago. So the dollar figure fell because the price did, not because positions were closed. Funding is near zero at 0.0046% every 8 hours, and $498.5 million of longs were force-closed against $104.6 million of shorts.
What this means for readers. A proper capitulation usually flushes leverage out. This one has not, which leaves fuel for another forced move lower if the price keeps sliding.
The Fed held rates at 3.75% to 4.00%, but that didn’t stop the bond market from moving hard. The two-year Treasury yield jumped from 4.51% to 4.88% and the ten-year from 4.86% to 5.15%, as hawkish commentary pushed traders toward pricing in hikes rather than cuts. The dollar index rose to 103.41, its highest in this series, and the rupee weakened past 94 to the dollar.
What this means for readers. This was a macro event that crypto amplified, not a crypto-specific one. If US rate expectations soften, the pressure eases. If they harden, the selling has further to run.
Level | Price | Why it matters |
|---|---|---|
Resistance | $79,039 | True Market Mean, the average cost of active investors |
Resistance | $75,703 | Short-term holder cost basis, and max pain at $75,000 |
Weekly close | $65,305 | Where the week ended, 17% below the True Market Mean |
Support 1 | $62,018 | This week’s low |
Support 2 | $60,000 | Heaviest block of put options |
Support 3 | $53,652 | Realized Price, the average cost of every coin |
Scenario | Trigger | Next level |
|---|---|---|
Bull case | ETF outflows stop and price reclaims $75,703 | $79,039, then the October range |
Base case | Price holds $62,018 and holder selling stops | A base between $62,000 and $75,000 |
Bear case | Weekly close under $62,018, leverage intact | $60,000, then $53,652 |
In rupee terms, Bitcoin closed near ₹61 lakh, against about ₹70 lakh a week ago and ₹83 lakh in early October. The weaker rupee softens the fall slightly for Indian holders, but it doesn’t change the direction.
The tax position bites hardest in a week like this. Gains on VDAs (Virtual Digital Assets, the legal term for crypto, tokens and NFTs) are taxed at a flat 30% plus 4% cess, and the exchange deducts 1% TDS on every transfer. Losses cannot be set off against gains, not even against gains on other crypto, and they cannot be carried forward.
The asymmetry is worth stating plainly. Sell one holding at a ₹5 lakh loss and another at a ₹5 lakh gain in the same year, and you still owe 30% tax on the full gain. The loss does nothing. An equity investor in the same position would owe nothing.
Sources: CoinMarketCap (9–15 Nov 2026), Token Terminal, BGeometrics, mempool.space, Farside Investors (9–13 Nov), Federal Reserve, FRED, Yahoo Finance, Deribit, CoinGlass, OKX and CryptoQuant.
India Crypto Research operates independently. The information presented herein is intended solely for educational and informational purposes and should not be construed as financial advice. Before making any financial decisions, it's essential to undertake your own thorough research and analysis. If you're uncertain about any financial matters, we strongly recommend seeking guidance from an impartial financial advisor.


