
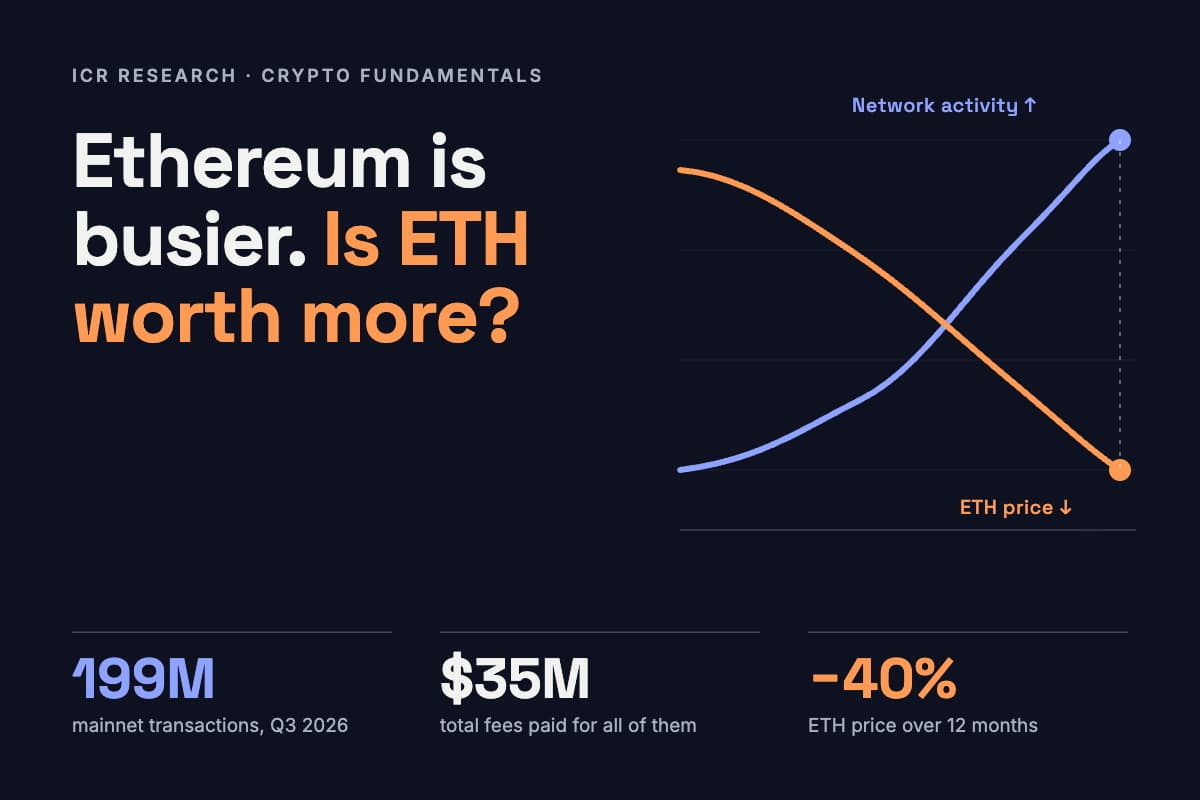
Ethereum is getting busier. ETH is not.
Why did the world need Ethereum when Bitcoin already existed?
What is Ethereum actually used for?
Layer 2s fixed scaling and created an economic puzzle
Can ETH be inflationary and deflationary at the same time?
Three connected on-chain signals
How do you value an asset with no earnings?
The risks investors should take seriously
Three paths for ETH over the next five years
What this means for Indian investors

 Part of a series
That gap is the focus of this article. Ethereum has become working financial infrastructure. The harder question is whether that success makes ETH, the asset, worth more.
| Metric | Reading | As of | Source |
|---|---|---|---|
| ETH price | About $2,260 to $2,300 | Nov 3 to 4, 2026 | Coinbase, OKX |
| ETH market cap | About $277 billion | Nov 4, 2026 | Coinbase |
| Stablecoins on Ethereum | About $139 billion | Nov 3, 2026 | DefiLlama |
| DeFi value locked | $44.0 billion | Nov 3, 2026 | DefiLlama |
| ETH staked | 43.8 million (35.9% of supply) | End of Q3 2026 | Bitwise |
| Net ETH supply growth | About +0.88% a year (30-day pace) | Oct 25, 2026 | ultrasound.money via CryptoTicker |
| Realized price | About $2,262 | Latest reading | Glassnode |
Bitcoin proved in 2009 that money could move between strangers without a bank. Its scripting language, however, is deliberately narrow. It can lock and release coins under very simple conditions, but it was never designed to run general-purpose programs.
In 2013, Vitalik Buterin proposed a blockchain that could. Ethereum went live in 2015, built around one main idea: the smart contract. A smart contract is a program stored on the blockchain that runs exactly as written whenever someone uses it. Think of it as a vending machine for financial agreements. The right input produces a guaranteed output, enforced by code rather than by a counterparty.
While they may seem like the same thing, Ethereum and ETH are different. Ethereum is the network. ETH is its native asset, and every action on the network is paid for in it. Sending a token or taking a loan uses computation, which is measured in units of gas and paid for in ETH. Owning ETH is a bet on demand for that computation and for ETH as collateral. It is not equity in a company.
An illustrative example: a user in Bengaluru deposits 1 ETH, roughly ₹2.15 lakh at the price quoted on CoinDCX in early November, into a lending protocol and borrows USDC, a dollar stablecoin, against it. No bank checks a credit score. The contract checks the collateral, and if the price of ETH falls far enough, it sells that collateral automatically.
| Feature | Bitcoin | Ethereum |
|---|---|---|
| Launched | 2009 | 2015 |
| Core purpose | Digital money and store of value | Platform for programmable finance and applications |
| Security model | Proof of work, secured by miners | Proof of stake since the Merge, September 2022 |
| Supply rule | Hard cap of 21 million | No hard cap; issuance minus burn sets supply |
| Programmability | Limited scripting | General smart contracts on the EVM |
| Main sources of demand | Monetary premium | Fees, collateral, staking and monetary premium |
What happens when the Bengaluru user clicks confirm:
Moving digital dollars is Ethereum’s biggest job right now. Stablecoin issuers Tether and Circle led all applications on mainnet by transactions in Q3 2026, ahead of the Uniswap exchange, according to growthepie. About $139 billion of stablecoins sit on Ethereum, per DefiLlama.
There are three other uses that involve real money:
Not every transaction on the blockchain is an economic signal. In Q2 2026, mainnet transactions hit a record high while active users fell, as reported by Token Terminal. That points to bots, protocols and high-frequency traders doing more of the work. On 21 October, active addresses on Base, a Layer 2 network, jumped 82.5% during a trading contest that required brand-new wallets.
The takeaway for readers is this. One blockchain address is not one person, and one transaction is not one customer. Visa’s on-chain analytics team strips automated and infrastructure activity out of stablecoin data for this reason. Any adoption claim should be checked against fees paid and value held, not counts alone.
Three upgrades changed the economics of rollups:
| Participant | How they earn | Recent signal |
|---|---|---|
| Validators and stakers | New ETH issuance, plus tips and MEV | 2.63% gross yield in Q3, 96% of it from issuance (Bitwise) |
| ETH holders | Burned base fees shrink supply | About 67 ETH burned a day against about 2,970 issued (October) |
| Layer 2 operators | User fees minus data costs paid to Ethereum | Robinhood Chain about $51 million in Q3 (ARK) |
| Applications | Fees from trading, lending and stablecoins | $6.84 million in app fees in 24 hours vs $0.29 million in chain fees (DefiLlama, Nov 3) |
MEV, or maximal extractable value, is the profit validators and specialised traders earn by choosing the order of transactions in a block. The table makes the central point plain: ecosystem revenue is not the same as ETH-holder value.
Yes, because two things drive ETH’s supply. The first is issuance: the protocol issues new ETH to validators as payment for securing the network. The second is EIP-1559, live since August 2021, which burns the base fee of every transaction, removing that ETH permanently. When issuance is greater than the burn, ETH’s supply grows. When the burn is greater than issuance, supply shrinks. Unlike Bitcoin, ETH has no fixed maximum supply.
After the Merge in September 2022 cut issuance sharply, busy periods pushed supply down, and supporters nicknamed ETH “ultrasound money”. That phase has ended for now. From 1 January to 9 October 2026, the network issued 796,623 ETH and burned only 16,525 ETH, a net addition of 0.64% of supply, according to ultrasound.money data compiled by CryptoSlate. Total supply is about 122.16 million ETH, some 1.6 million above its level at the Merge.
The mathematics of a reversal is demanding. ultrasound.money estimates that the burn would match issuance at an average base fee of about 13.6 gwei (one gwei is one billionth of an ETH). Over the 30 days to 25 October, the burn averaged about 67 ETH a day. It would need to rise roughly 44 times to cover issuance of about 2,970 ETH a day.
Is staked ETH a yield-bearing asset? Partly. Staking means locking up ETH with a validator to help secure the network, in exchange for rewards. A record 43.8 million ETH, 35.9% of supply, was staked at the end of Q3, Bitwise reports. The gross staking yield was 2.63%.
What generates that yield matters more than its size. Of the 2.63%, 2.53 percentage points came from new issuance and only 0.10 percentage points from fees and MEV. A bond coupon is paid from the borrower’s cash flow. Staking yield is mostly paid in newly minted ETH, which mainly offsets the dilution borne by non-stakers. Stakers also take on slashing risk, meaning the loss of staked funds due to validator faults, as well as queues to enter and to exit. An October snapshot showed about 813,000 ETH waiting to be withdrawn. Staked ETH is locked, not destroyed, and can return to circulation.
On-chain means recorded directly on the blockchain, visible to anyone. Of the many on-chain metrics available, three, read together, show whether usage is turning into value for ETH holders. Each measures a different link in the chain, from adoption to value capture to supply.
| Indicator | Question it answers | Latest reading | What would change the picture |
|---|---|---|---|
| Active addresses, L1 and L2 | Is real economic use growing? | Mainnet 2.41 million weekly active addresses; Base 1.58 million (week to Oct 20, growthepie) | A rise sustained over 30 and 90 days, matched by rising fees paid |
| ETH burned | Is usage accruing to ETH holders? | About 2,018 ETH over 30 days, roughly $4.6 million (to Oct 25) | A sustained climb toward issuance of about 2,970 ETH a day |
| Net supply growth, read with the staking ratio | Is ETH getting scarcer? | About +0.88% a year; 35.9% of supply staked | Net growth near zero or negative across a full quarter |
Each of the three has limitations. Address counts can be inflated by bots and fresh-wallet campaigns, and the same person may hold many addresses on many chains, so totals across chains are not unique users. Burn figures should be read in both ETH and dollars over 30 and 365 days, and kept separate from tips and MEV paid to validators. Staking reduces the liquid supply, but it doesn’t remove ETH permanently.
For price-cycle context, MVRV is a useful fourth metric. It belongs in valuation rather than fundamentals, so it is covered in the next section.
ETH is not equity. Holders own no shares of a company and have no legal right to a share of profits. In its April 2026 research, Bitwise argues ETH is better treated as a commodity-like network asset, valued with several lenses rather than a single revenue multiple. We test four, all based on an ETH market cap of about $277 billion on 4 November 2026.
| Approach | Calculation | Result | How to read it |
|---|---|---|---|
| Network value to fees | $277 billion ÷ annualized Q3 mainnet fees ($35.1 million × 4 = $140 million) | About 1,970× | The market pays far more than current fee generation justifies on its own |
| Market cap to ETH burned | $277 billion ÷ annualized burn (2,018 ETH × 365 ÷ 30 × $2,280 = $56 million) | About 4,900× | The burn is too small to anchor value today |
| MVRV | Spot price about $2,260 to $2,300 ÷ realized price about $2,262 to $2,309 | About 1.0 | The average holder sits near break-even |
| Security-based floor | Bitwise cost-to-corrupt model | About $152 billion (April 2026) | A model floor; the market then traded about 70% above it |
MVRV, the market value to realized value ratio, compares market value with realized value, an estimate of what holders collectively paid based on the price when each coin last moved. Readings near 1.0 have historically marked periods of market stress, not euphoria. Realized value needs the full on-chain history, so it cannot be built from exchange price data alone.
The sensitivity of the fee multiple shows how far fundamentals sit from price. Holding the market cap at $277 billion, annual mainnet fees of about $500 million would imply a multiple of about 554×. Fees of about $2.77 billion, roughly 20 times the Q3 run rate, would be needed to bring it down to 100×.
The four lenses disagree, and that is the finding. Fee-based measures say ETH is priced for a future that current fees do not show. Cost-basis and security measures say the price is not stretched. Price also moves closely with Bitcoin: a Bitwise factor model found that Bitcoin explains about 65% of the weekly variation in ETH’s returns. A valuation multiple is simply a description of expectations, not a verdict on fair value.
These figures mix sources with different definitions. Network fees, ETH burned and validator earnings are separate measures, and the price-to-fees ratio is not a conventional price-to-earnings ratio.
ETH’s value over the next five years depends not only on how much activity Ethereum attracts, but also on how much of it becomes durable demand for ETH. These are scenarios, not price forecasts, and each is defined by conditions readers can check.
| Condition | Bear | Base | Bull |
|---|---|---|---|
| Ecosystem activity | Declines or moves to rival chains | Grows gradually | Grows strongly, led by stablecoins and tokenized assets |
| Mainnet and blob fee capture | Keeps weakening | Stable | Recovers as L1 handles high-value settlement |
| Net supply growth | Stays near +0.9% a year or higher | Drifts toward zero | Turns negative for sustained periods |
| ETH as collateral and staking asset | Loses share to stablecoins and rival tokens | Holds its role | Deepens through institutional staking products |
| Valuation implication | Lower multiples justified | Moderate multiples | Higher multiples defensible |
The markers ICR will track between issues:
If fee capture keeps falling while adoption keeps rising, the bull case has to resolve that contradiction rather than ignore it. If fee capture recovers alongside adoption, the bear case loses its strongest point.
India taxes ETH like any other VDA (Virtual Digital Asset, the legal term for crypto, tokens and NFTs). The Income-tax Act, 2025 replaced the Income Tax Act, 1961 from 1 April 2026. Section numbers changed, but the substance stayed the same.
| Rule | Income-tax Act, 1961 (sales up to Mar 31, 2026) | Income-tax Act, 2025 (sales from Apr 1, 2026) |
|---|---|---|
| Flat 30% tax on VDA transfer income, plus surcharge and 4% cess | Section 115BBH | Section 194, Table serial 4 |
| 1% TDS on VDA transfers | Section 194S | Section 393(1), Table serial 8(vi) |
| Definition of VDA | Section 2(47A) | Section 2(111) |
| Reporting of crypto-asset transactions by prescribed entities | Not codified | Section 509 |
Only the cost of acquisition can be deducted. A loss on one VDA cannot be set off against a gain on another VDA, or against any other income, and it cannot be carried forward. TDS (Tax Deducted at Source) is the tax an exchange deducts automatically at the time of the trade, and it counts as advance tax, not as an extra tax.
A worked example. You buy 1 ETH for ₹2,00,000 and sell it for ₹2,50,000. The tax is 30% of the ₹50,000 gain, or ₹15,000, plus 4% cess, which comes to ₹15,600 before any surcharge. The exchange deducts 1% of the ₹2,50,000 sale value, or ₹2,500, as TDS, which you can claim as a credit when you file your tax return. Staking rewards raise separate questions about when income arises, so consult a tax professional about their treatment before you stake.
Two practical points follow from this issue. First, holding crypto in a self-custody wallet carries different risks from holding it on an exchange. The Binance hack is a reminder that coins on an exchange depend on that exchange’s security. Second, India has no dedicated crypto law. The RBI (Reserve Bank of India) does not recognise crypto as legal tender, and SEBI does not regulate VDAs directly. Exchanges serving Indian users must register with FIU-IND (the Financial Intelligence Unit) under the PMLA (Prevention of Money Laundering Act). Check that an exchange is registered with FIU-IND before you use it.
Sources: Data as of 4 November 2026 unless stated, from Coinbase, OKX, CoinDCX, DefiLlama, growthepie, Token Terminal, Bitwise, ultrasound.money, CryptoSlate, Glassnode, ARK Invest, rwa.xyz and the Ethereum Foundation. Additional reporting from FXStreet, KuCoin, CryptoTicker, The Cryptonomist, TechReport, Al Jazeera, Dalimss News and CalcGuru.
India Crypto Research operates independently. The information presented herein is intended solely for educational and informational purposes and should not be construed as financial advice. Before making any financial decisions, it's essential to undertake your own thorough research and analysis. If you're uncertain about any financial matters, we strongly recommend seeking guidance from an impartial financial advisor.


