
1. Bitcoin mining
2. The United States in the global picture
3. The main US mining companies
4. How much do they mine?
5. Power: where it comes from and what it costs
6. Public miners: production and treasury
7. The Texas model: miners as flexible load
8. Mining pools and Foundry USA

The US is the biggest mining country. Estimates of its hashrate share run from 34.1% to 42.5%.
Electricity is the largest running cost. Reported costs are about 3.0 to 5.2 US cents per kWh.
Texas pays miners to switch off. Riot earned $30.6 million in curtailment credits in Q3 2025 alone.
Foundry USA is the largest pool. It coordinates about a quarter of network hashrate.

 Part of a series
To put it simply, thousands of computers on the Bitcoin network race to add the next block to the blockchain, the shared public record of all Bitcoin transactions. The winner gets newly issued bitcoin plus the transaction fees. It works like a lottery where more guesses mean more tickets: the first computer to find the right answer to a cryptographic puzzle wins. A new block arrives about every 10 minutes, and the difficulty of the puzzle adjusts every two weeks to hold that pace. The reward for each block is currently 3.125 BTC.
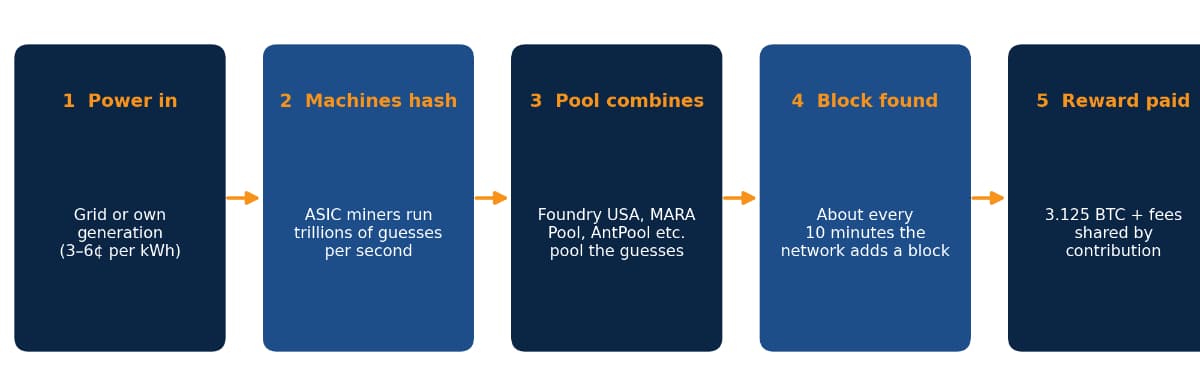
Figure 1: From electricity to bitcoin reward.
The guessing is done by special-purpose machines called ASICs (Application-Specific Integrated Circuits), built for this one task only. Each guess costs energy, and the whole security of Bitcoin rests on the fact that guessing is expensive. This is why miners set up shop where electricity is cheapest, and why power cost decides who survives when prices fall.
China banned crypto mining in 2021. Before the ban, the country hosted most of the Bitcoin network. After it, miners moved abroad, and the United States became the largest host.
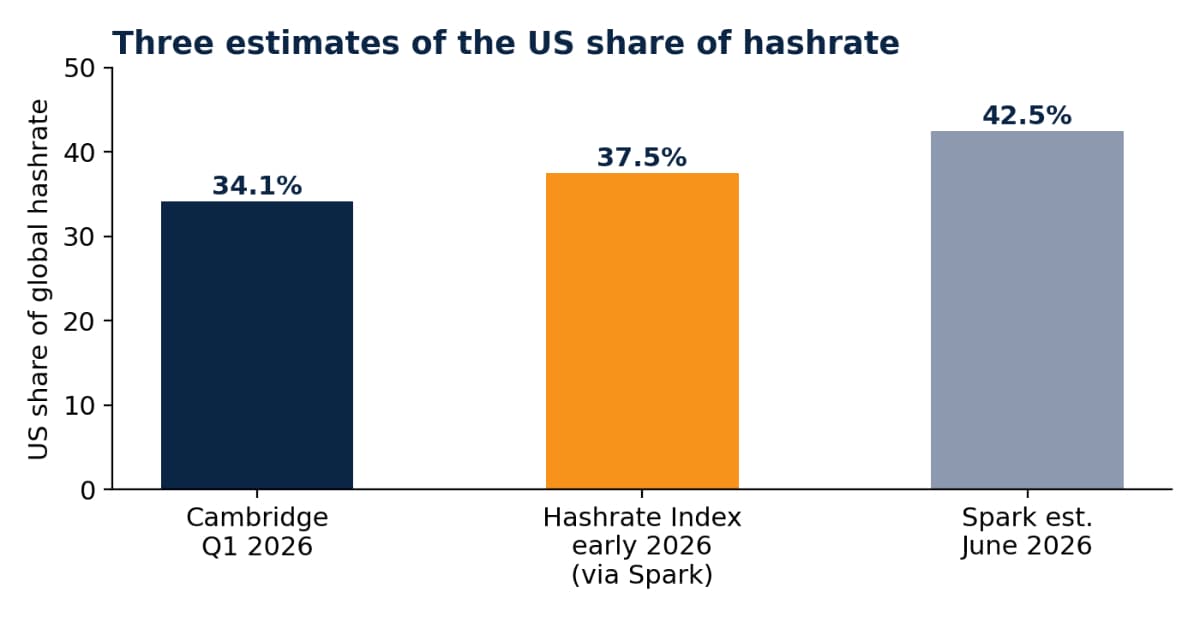
Figure 2: US share of global hashrate, three estimates.
Source | US share | Note |
|---|---|---|
Cambridge CCAF, Q1 2026 | 34.1% | Peak was about 42% in late 2024. |
Hashrate Index, early 2026 | 37.5% | Russia 16.4%, China 11.7%. |
Spark, June 2026 | ~42.5% | Method not detailed; high end. |
Table 1: Estimates of US share of global hashrate.
Cambridge surveyed 49 firms (48% of the network) and warned that its US figure is probably overstated. A share of a third to two-fifths of global hashrate is a fair estimate. Texas is the centre of US mining because its ERCOT power market is deregulated (see Section 7), while Kentucky, Georgia, New York and Wyoming also host significant capacity.
Periods differ by company, so read Table 2 as a snapshot and not a ranking.
Company | Latest output | Hashrate | Power cost | Market cap | Latest quarter |
|---|---|---|---|---|---|
MARA Holdings | 2,422 BTC (Q2 2026) | 70.3 EH/s energized | 4.0¢/kWh (owned sites) | Not retrieved | Loss $611.3M; revenue $174.9M |
Riot Platforms | 1,473 BTC (Q1 2026) | 42.5 EH/s deployed | 3.0¢/kWh all-in | $8.63B | Loss $237.2M; revenue $174.2M (Q2) |
CleanSpark | 1,799 BTC (Jan–Mar); 614 BTC (June) | 50 EH/s operational | 5.2¢/kWh | $3.43B | Loss $239.8M; revenue $138.0M |
Core Scientific | About 300 BTC (Q2 2026) | Not expanding | Not disclosed | $6.04B | Revenue $164.2M; 83% AI |
Table 2: Company snapshot. Market caps from Yahoo Finance, 22–28 September 2026.
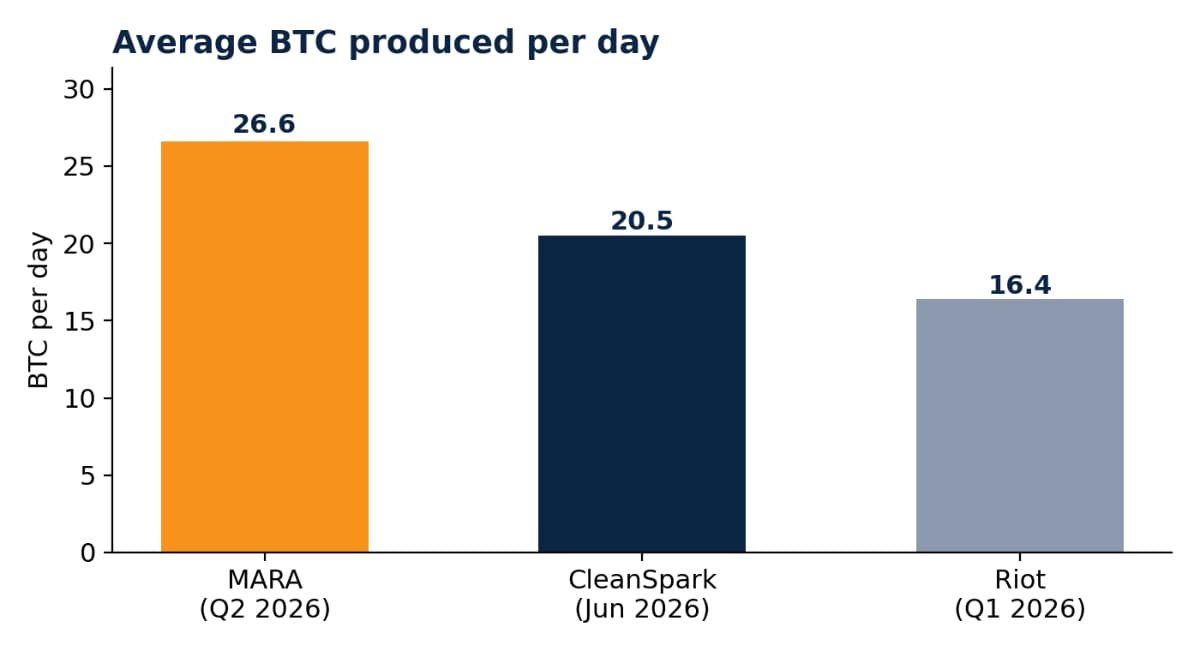
Figure 3: Average BTC produced per day. Periods differ.
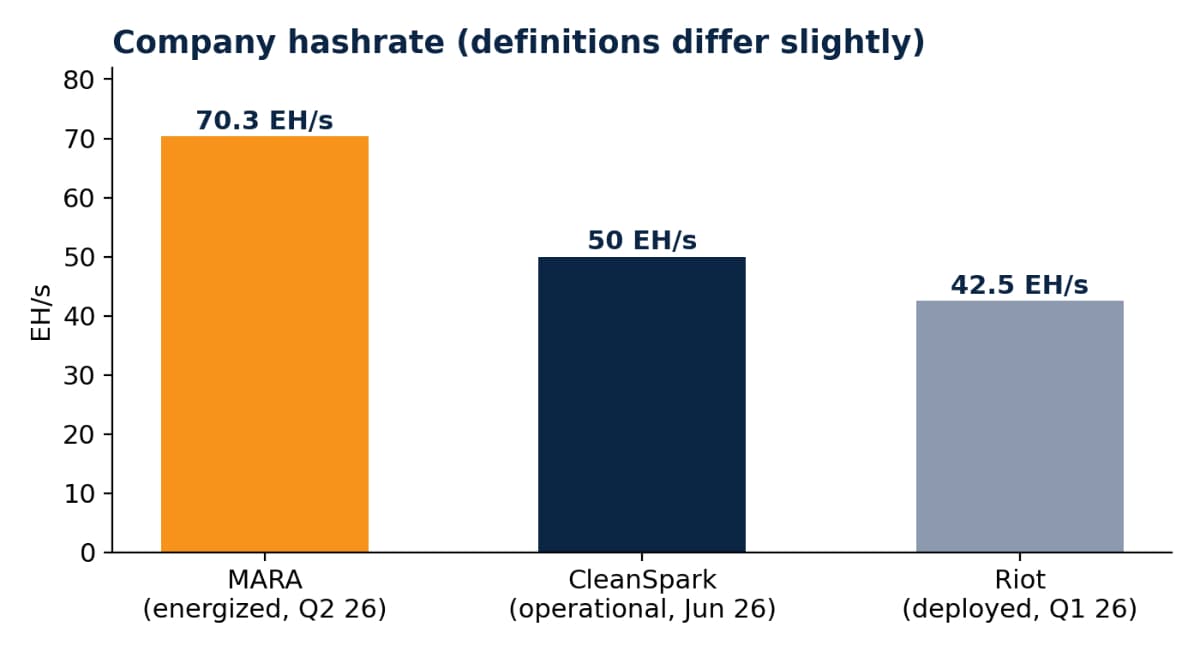
Figure 4: Company hashrate (energized, operational or deployed).
The whole network issues about 450 BTC a day, so MARA’s 26.6 BTC a day is roughly 6% of all new bitcoin. That lines up with MARA Pool’s 5.27% share of blocks on Hashrate Index.
An interesting pattern is that some miners sell more BTC than they produce. Riot sold 3,778 BTC against 1,473 produced. Core Scientific sold more than 2,000 BTC across the first half of the year. In contrast, MARA bought none in Q2 but kept most of its stack, and CleanSpark has held much of its output.
Most US miners buy power from the grid or sign long-term contracts with power producers. They don’t usually build their own power plants, although MARA’s wind farm and its Long Ridge deal are moves toward owning supply. Three patterns stand out.
• Cheap grid power in Texas. ERCOT wholesale prices let miners buy power at about 4 to 6 cents per kWh, and Texas offers tax abatements.
• Selling flexibility. Riot earned $21 million in power credits in Q1 2026, up 171% from a year earlier, mostly for switching off during grid stress. Those credits pulled its all-in power cost down 21% to 3.0 cents.
• Wind, solar and stranded gas. Miners use surplus renewable power and natural gas that would otherwise be flared off. Texas has some of the cheapest utility-scale solar in the country, at about 2.8 cents per kWh.
Globally, the Cambridge survey puts mining’s sustainable energy share at 52.4% (April 2025). US miners vary widely, from ERCOT (grid power, part wind and solar) to Kentucky (grid power, heavily coal-based). A US-specific number is worth checking against primary data before this report is used in a formal submission.
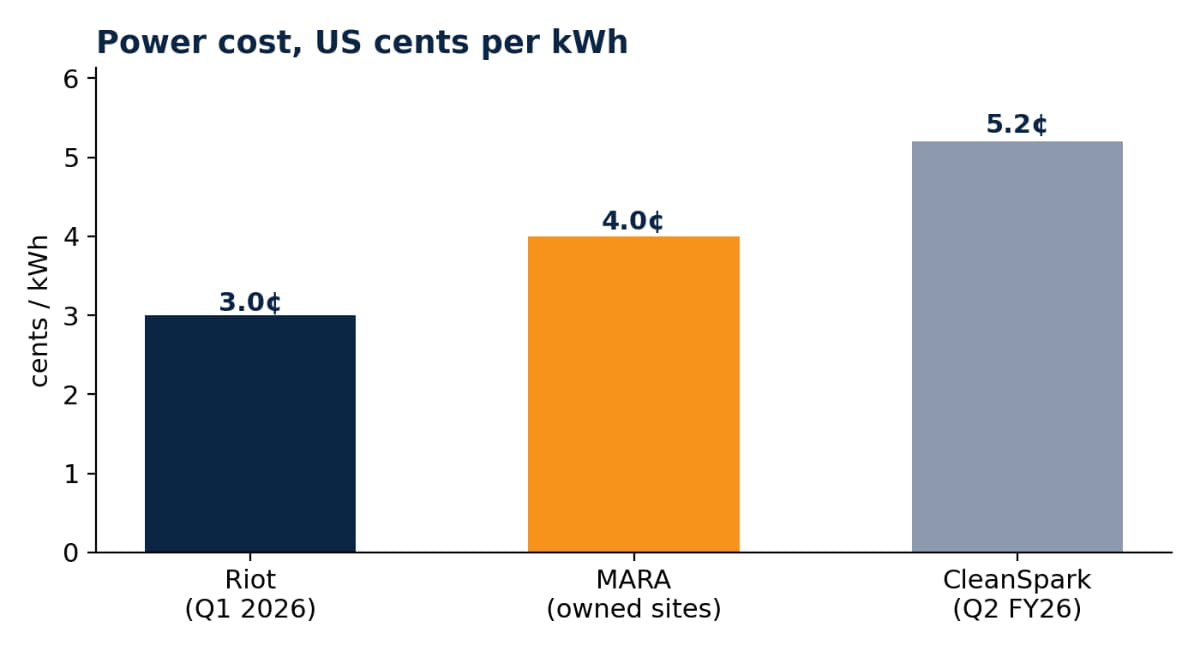
Figure 5: Power cost per kWh. Riot’s is net of credits.
As difficulty climbed, MARA’s energy cost per bitcoin rose to $38,690, while CleanSpark improved to 5.2 cents per kWh from 5.6. One estimate puts the industry’s cost at about $74,300 per bitcoin (January 2026).
An Antminer S23 XP Hyd (600 TH/s, 5,340 watts) earns $23.84 a day. Each cent of power price is worth about $1.28 a day per machine, or nearly $47 million a year across 100,000 machines.
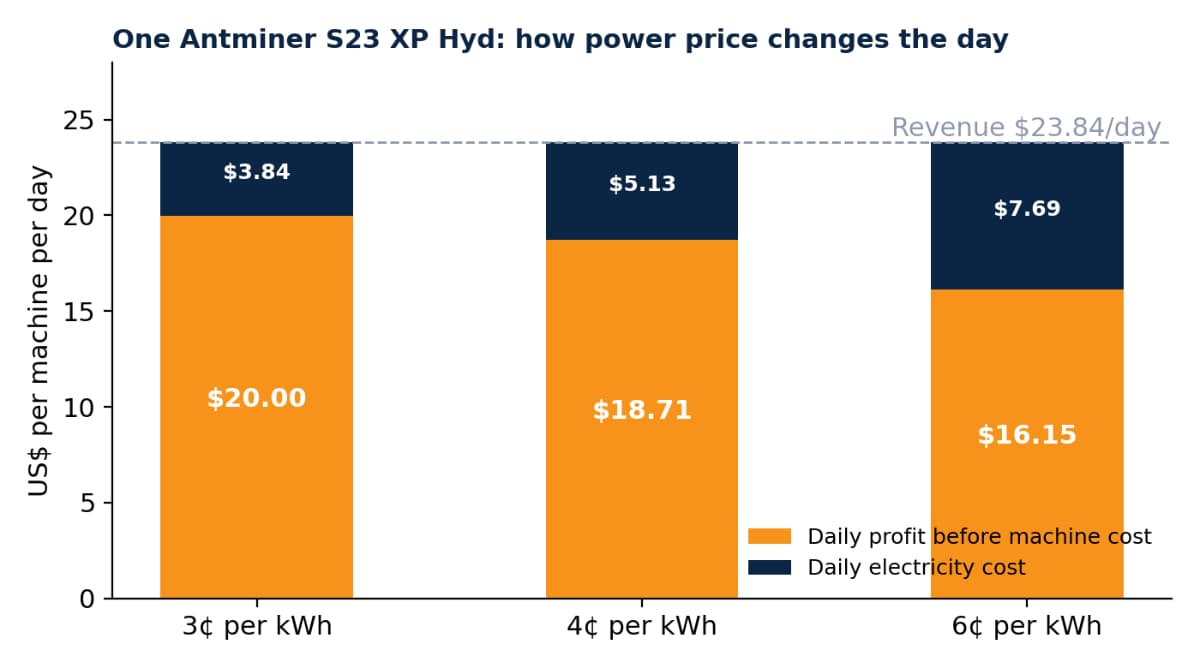
Figure 6: One machine’s daily economics at three power prices. Author’s calculation.
A capital.com ranking puts the three pure-play miners on one footing (Table 3).
Company | Recent output | BTC/day | Treasury | Footprint |
|---|---|---|---|---|
MARA (MARA) | ~2,011 BTC (quarter) | ~21.9 | 35,577 BTC | 70.3 EH/s globally |
CleanSpark (CLSK) | 593 BTC (month) | ~19.1 | 13,703 BTC | 50.0 EH/s, mainly Georgia and Texas |
Riot (RIOT) | 1,473 BTC (quarter) | ~16.4 | 15,680 BTC | 42.5 EH/s, centred in Texas |
Table 3: Production and treasury. Source: capital.com ranking.
Together they mine about 57.4 BTC a day, roughly 12.8% of the 450 BTC issued daily, and hold 64,960 BTC. MARA’s treasury is more than the other two combined and equals about 4.4 years of its output, against 2.6 years for Riot and 2.0 years for CleanSpark. Output per EH/s is 0.31 BTC a day for MARA, 0.38 for CleanSpark and 0.39 for Riot, though fleet size and output cover different dates.
These figures differ from Table 2 because of reporting dates (MARA 2,422 BTC, CleanSpark 614 BTC and a 13,924 BTC treasury there). Company filings take priority.
Riot and Bitdeer share the former Alcoa aluminum plant site at Rockdale. Together, the four operators below span six Texas locations.
Company | Texas sites | Scale |
|---|---|---|
Riot Platforms | Rockdale; Corsicana | Largest Texas facility; newer Corsicana site. |
Bitdeer | Rockdale | Industrial-scale, former Alcoa site. |
IREN (Iris Energy) | Sweetwater; Childress | Hundreds of MW of data-centre capacity. |
Cipher Mining | Odessa; Wink | Hundreds of MW of infrastructure. |
Table 4: Major Texas operations. Source: capital.com.
ERCOT, the Texas grid market, is the main test bed for miners as flexible load.
Measure | Figure |
|---|---|
Crypto mining demand in Texas | 4,288 MW (Nov 2025); above 5,300 MW by 2027 |
ERCOT-approved large flexible load, incl. AI data centres | About 9,500 MW (end 2025) |
Expected use by that category | 54 billion kWh in 2025, about 10% of ERCOT forecast |
Riot Rockdale facility | 700 MW |
Riot curtailment credits | $30.6M in Q3 2025, up 147% |
Riot, November 2025 | $1.0M curtailment plus $1.3M demand response |
Table 5: Texas flexible-load figures.
Texas mining demand is projected to grow about 24% by 2027. If it sits inside the 9,500 MW category (not confirmed), it makes up about 45% of it. Running 4,288 MW all year would use roughly 37.6 billion kWh, but that is a ceiling, since miners switch off when the grid is tightest.
Miners contract with grid operators or join ancillary-services markets. When prices spike during extreme heat or cold, they cut or halt operations. They earn by selling their contracted power back at spot prices and from demand response payments. In surplus periods, they ramp up and absorb power that might otherwise be wasted.
Riot’s Q3 2025 credits of $30.6 million, up 147%, imply about $12.4 million a year earlier and work out to roughly $333,000 a day. November’s $2.3 million, 57% of it from demand response, averaged about $77,000 a day; summer price peaks probably explain the gap. If all the Q3 credits came from Rockdale, that is about $43,700 per MW, an upper bound since Riot also runs Corsicana.
Renewable generators gain a buyer of last resort, grid operators gain load they can switch off, and miners get cheaper power in exchange for interruptible supply. Cambridge CCAF found this benefit strongest in markets with high renewable penetration.
Why this matters: Texas miners earn income from the grid as well as from bitcoin. Caution: the credit data covers Riot only, income swings with price spikes, and the 9,500 MW figure includes AI data centres.
A pool combines many miners’ computing power and shares each reward according to how much each one contributed. Members get steady small payments instead of rare large ones. Under the FPPS payout method, a pool pays the expected block reward plus fees whether or not it finds a block. A pool does not own the mining machines, and a pool’s share of hashrate does not tell you where the miners are located.
The world’s largest mining pool is run by Foundry, which was formed in 2019 as a subsidiary of Digital Currency Group. Foundry is based in Rochester, New York, and is led by CEO Mike Colyer, formerly of Core Scientific.
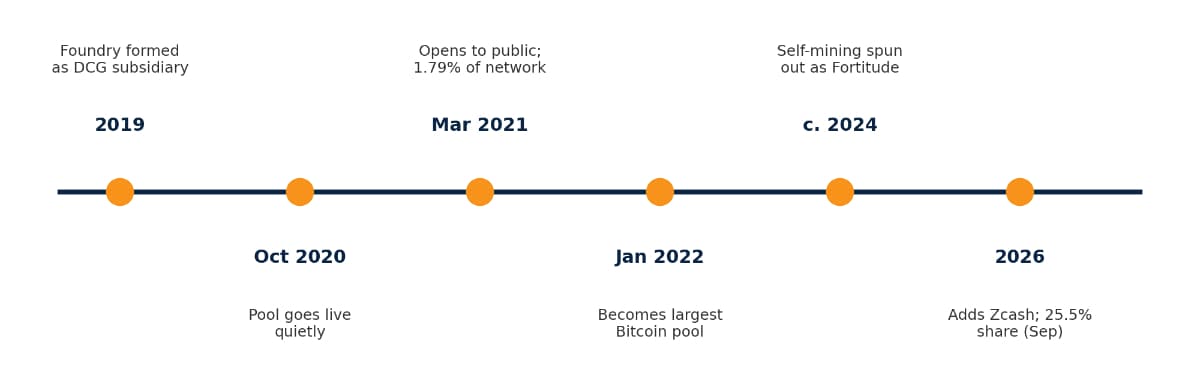
Figure 7: Foundry USA timeline. The Fortitude Mining date is approximate.
• An American institution. It was built to bring legitimacy and North American capital to a sector dominated by China.
• Serves institutions. Listed miners need auditable payouts.
• Brought machines to the US. Bitmain credits Foundry’s activity for its shipments into the US.
• Concentrates influence. Controlling a quarter or more of blocks is a risk, though members can switch pools and the share is far below 51%.
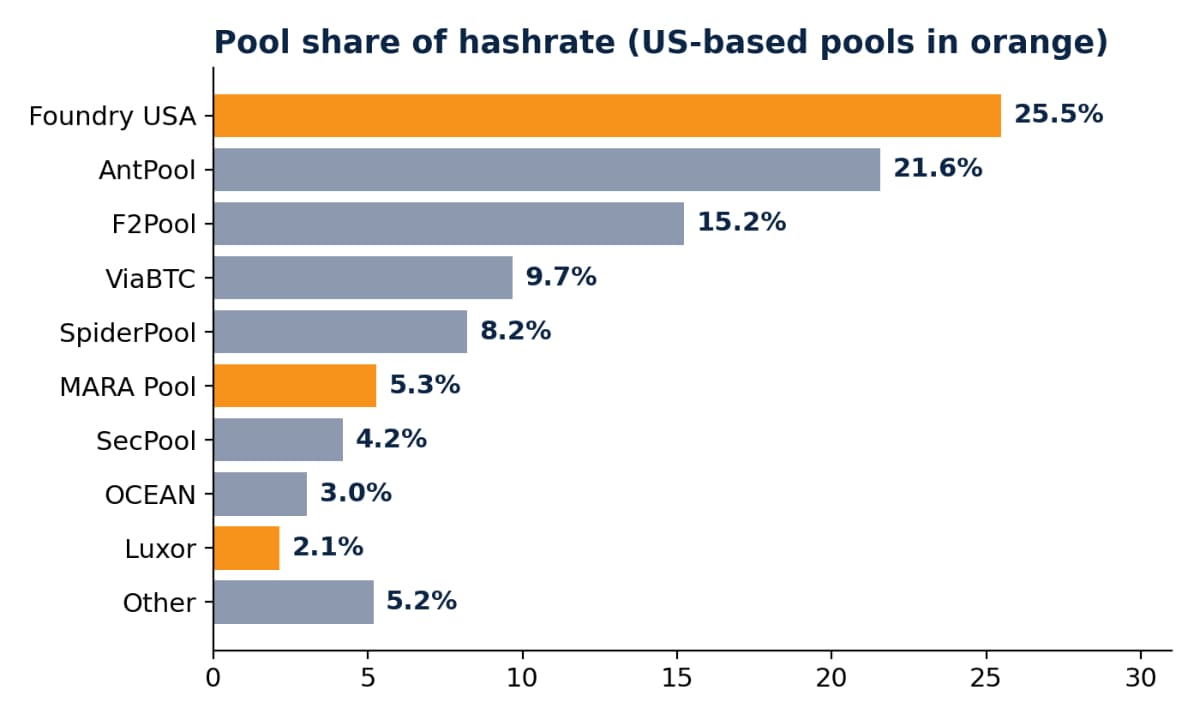
Figure 8: Pool share of network hashrate. US-based pools in orange. Source: Hashrate Index.
Rank | Pool | Hashrate | Share | Payout |
|---|---|---|---|---|
1 | Foundry USA | 243.4 EH/s | 25.49% | Unknown |
2 | AntPool | 206.1 EH/s | 21.58% | FPPS |
3 | F2Pool | 145.5 EH/s | 15.23% | Unknown |
4 | ViaBTC | 92.3 EH/s | 9.67% | PPS+ |
5 | SpiderPool | 78.3 EH/s | 8.20% | FPPS |
6 | MARA Pool | 50.4 EH/s | 5.27% | Unknown |
7 | SecPool | 40.1 EH/s | 4.20% | FPPS |
8 | OCEAN | 28.9 EH/s | 3.03% | Unknown |
9 | Luxor | 20.5 EH/s | 2.15% | FPPS |
Table 6: Top pools on Hashrate Index.
Foundry, MARA Pool, and Luxor together hold about 33% of network hashrate, similar to estimates of the US share of mining, though the two measures differ.
Sources: Hashrate Index, Yahoo Finance, MARA, Riot and CleanSpark 2026 filings, Core Scientific Q2 coverage, Foundry, Fortune, The Block, Spark.money, Cambridge CCAF (Q1 2026), capital.com, Cointelegraph, CoinGeek, and Forklog.
India Crypto Research operates independently. The information presented herein is intended solely for educational and informational purposes and should not be construed as financial advice. Before making any financial decisions, it's essential to undertake your own thorough research and analysis. If you're uncertain about any financial matters, we strongly recommend seeking guidance from an impartial financial advisor.


