Monday to Thursday, 31 August to 3 September
Friday, 4 September: the jobs report cools things down
Monday, 7 September
ETF flows swung both ways
Solana still leads on real-world assets.
A death cross is now in place.
What it means

 Part of a series
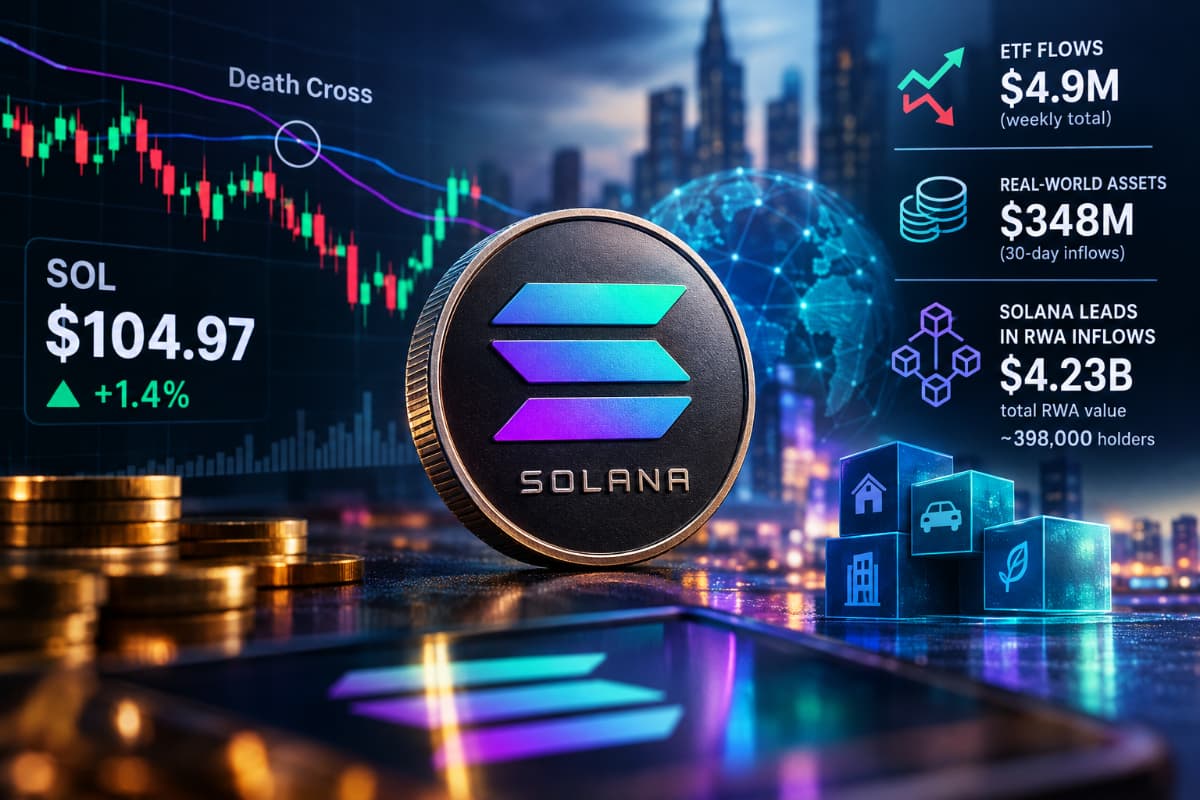
SOL closed the week at $104.97, up from $103.01 seven days earlier. That modest gain hides a genuinely choppy week, two sessions testing $100 from above before a recovery, a technical death cross that's now in place, and Solana pulling in more real-world-asset money than any other blockchain. Here's everything that happened.
SOL closed Monday at $103.01. Tuesday it slipped to $100.03, briefly touching an intraday low of $98.53. Wednesday held roughly flat at $100.39, trading in a tight band between $97.54 and $100.57. Over three sessions, SOL never strayed far from the $100 line in either direction.
The same Fed Governor Waller comments that lifted bitcoin and ether pulled SOL along with them. It climbed to $103.93, touching an intraday high of $105.46, its best level in over a week.
SOL gave back some of Thursday's gain, closing at $101.93 as the stronger-than-expected August jobs report weighed on risk assets across the board, echoing the same reversal that hit bitcoin and ether that day.
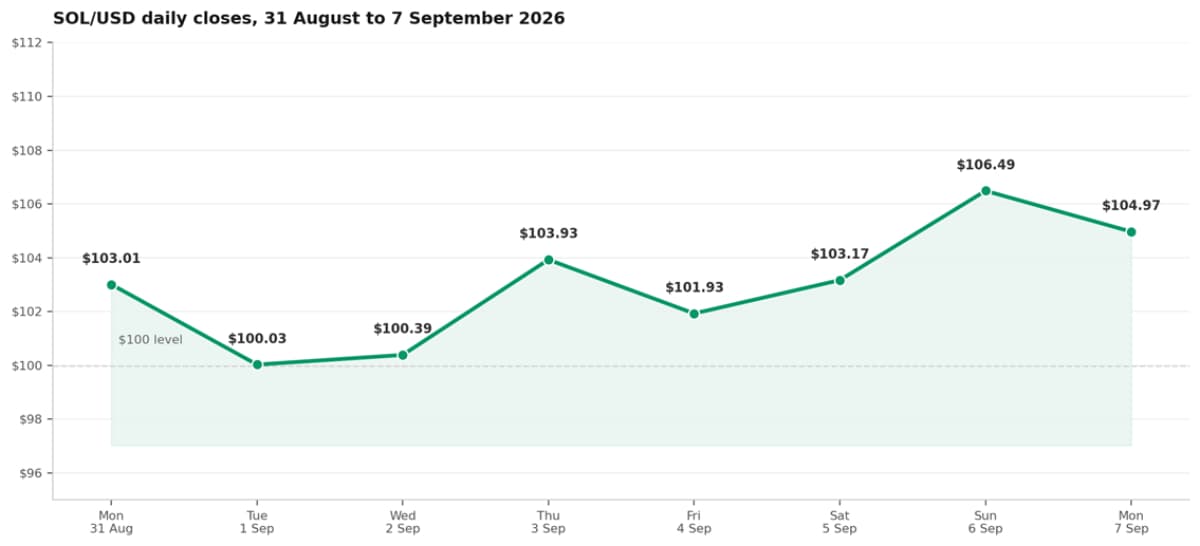
Solana's full week, 31 August to 7 September 2026. Built from verified data points cited in CoinGecko and Coinlore.
SOL recovered through the weekend, closing Saturday at $103.17, then Sunday at $106.49, its high close for the week and its best level since the August rally peaked near $110.
SOL opened at $106.46 and pushed to an intraday high of $106.80 before sellers stepped in. It fell as low as $104.22 before closing at $104.97, down 1.4% on the day. Buyers defended the pullback and pushed SOL back above $106 later in the session, but repeated failures to clear $107 suggest sellers are still active below August's peak.
Solana ETFs opened the week with a modest $0.9 million inflow on Monday, then jumped to $8.9 million on Tuesday. Wednesday reversed hard, $6.1 million out. Thursday recovered to $6.4 million in, before Friday gave most of it back with a $5.2 million outflow. Add it up and the week landed at just $4.9 million, a 97% collapse from the $142.7 million the category pulled in the week before. The category stayed positive rather than flipping negative, but barely, only three of the six tracked Solana ETFs, BSOL, FSOL, and GSOL, recorded any non-zero flows at all during the week.
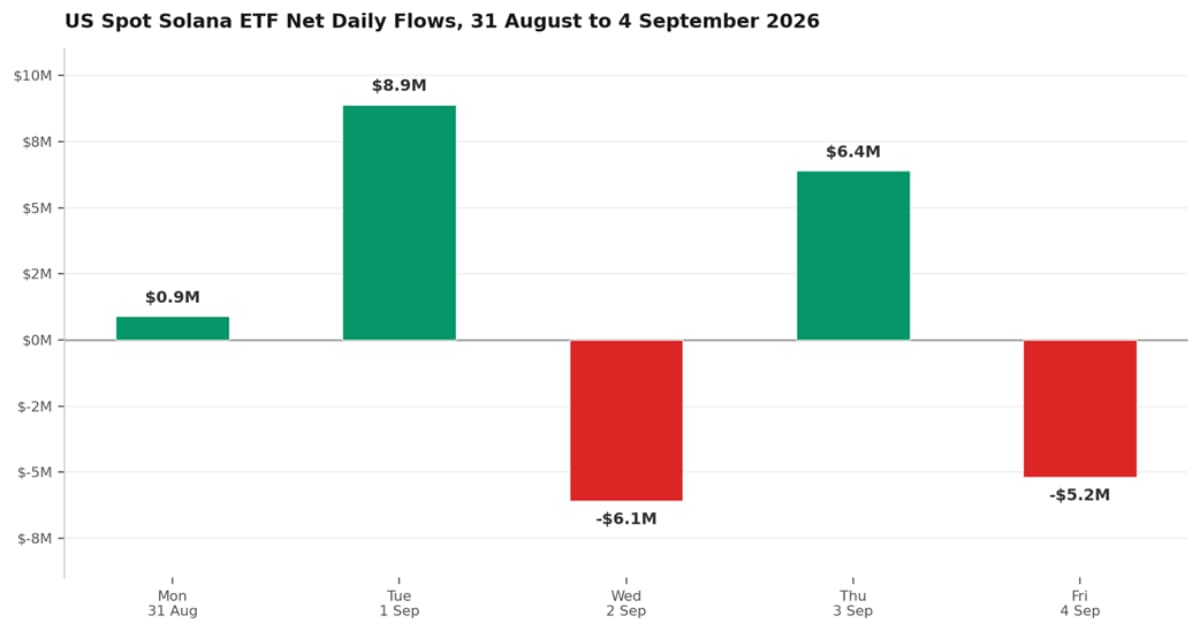
US spot Solana ETF net daily flows, 31 August to 4 September 2026, five trading days. Built from verified data cited directly from Farside Investors' live flow table.
Away from the ETF slowdown, Solana's underlying network kept growing. The chain led every blockchain in real-world-asset inflows over the past 30 days, pulling in $348 million and pushing total distributed RWA value on Solana to $4.23 billion across roughly 398,000 holders, according to the RWA Foundation. That's the structural case institutional buyers keep pointing to, even in a week when the ETF numbers themselves cooled off.
Not every signal this week was bullish. Technical analysts flagged a death cross on SOL's chart, a bearish signal that forms when a shorter-term moving average crosses below a longer-term one. It doesn't guarantee further weakness on its own, and buyers have kept defending support through the week, but it keeps the broader trend fragile heading into the next few sessions.
$105 is the level that matters most right now, a resistance cluster where the 23.6% Fibonacci retracement, a descending trendline, and the 50-week moving average all converge. SOL's Sunday close above it didn't hold through Monday. Clear it decisively and $134 becomes the next real test. Below current levels, Fibonacci support sits at $102.50, $101.51, $100.53 and $99.14, with a deeper floor between $90.46 and $94.83 if those all give way. Derivatives data adds one more wrinkle: leveraged CME funds are still net short SOL, though that short exposure shrank slightly over the week even as ETF demand cooled, two different signals worth watching separately rather than reading as the same thing.
Data as of 7 September 2026. Prices and figures sourced from CoinGecko, Coinlore, Crypto news, Farside Investors, CryptoSlate, CoinCentral, Blockonomi and CoinDoo reporting.
India Crypto Research operates independently. The information presented herein is intended solely for educational and informational purposes and should not be construed as financial advice. Before making any financial decisions, it's essential to undertake your own thorough research and analysis. If you're uncertain about any financial matters, we strongly recommend seeking guidance from an impartial financial advisor.