
This week in one minute
What did the funds do?
Where did the coins go?
How much profit came off the table?
Who was forced out?
What are options traders paying for?
The network continued to expand
Macro came back
Where are the key levels?
What It Means for Indian Readers
What is still to come

Bitcoin closed at $82,018 (about ₹77.9 lakh), down 2.0% from last week, a second losing week in a row.
Hotter-than-expected US inflation numbers dragged Bitcoin to $79,736, less than 1% above the True Market Mean, and buyers defended it.
Spot ETFs sold a net $228 million this week, about a third of last week's $679 million.
Long traders lost $213 million to forced closures, almost three times the $79 million lost by short sellers.

 Part of a series
The sellers showed up last week. This week they ran into a floor. The hotter-than-expected US inflation report on 14 October pushed Bitcoin below $80,000 for the first time in four weeks and forced leveraged longs to liquidate on the way down.
The selling stopped almost exactly where the average active investor breaks even. The funds kept selling, but more slowly, and the profit cushion that protected the market in September is now thin.
1. The close was at $82,018, down 2.0%. Still 3.6% above the True Market Mean.
2. ETF outflows were $228 million. Smaller outflows than last week, but the second straight week of selling.
3. The Bitcoin supply in profit fell from 71.6% to 69.3%. A smaller decline than last week's seven-point drop.
4. Once again longs took the damage. $213 million of bullish bets were liquidated versus $79 million of bearish bets.
5. The Bitcoin network hash rate rose to a new high for this series of 1,020 EH/s. Difficulty rose 5.9% as miners continued to build.
Spot ETFs continued to sell, but at a third of last week's pace.
Between 12 and 16 October, US spot Bitcoin ETFs lost a combined $228 million. The week was choppy. Tuesday added $176 million, and Wednesday, the day of the hot inflation report, lost $261 million. Friday saw another $82 million of outflows.
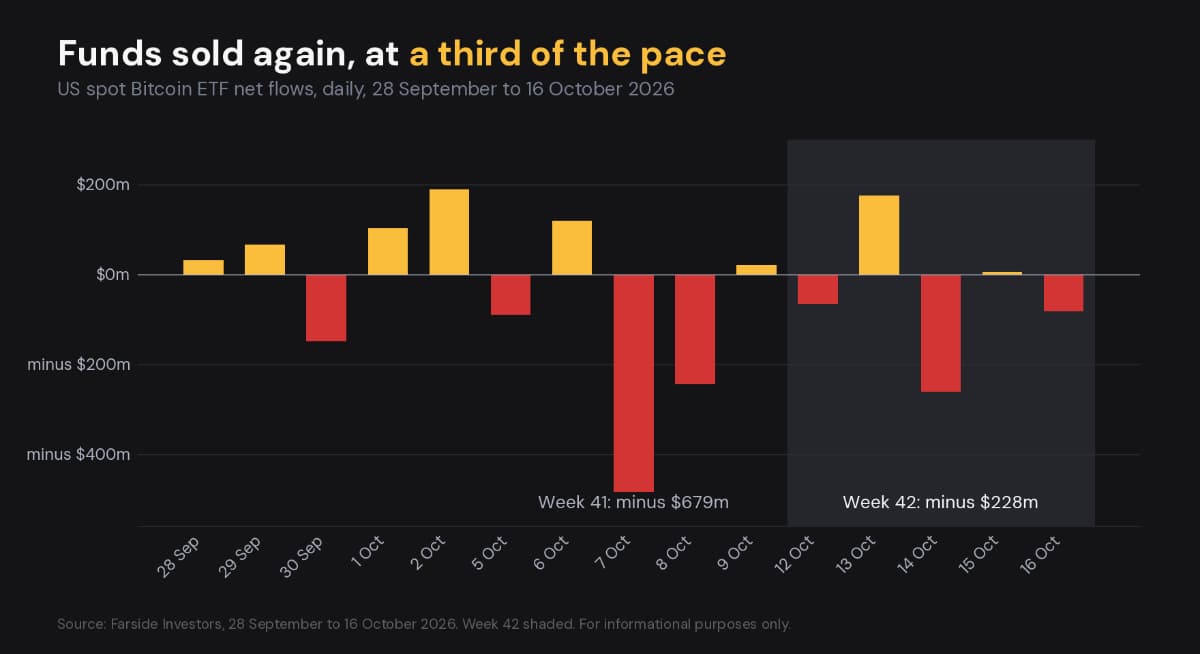
Daily US spot Bitcoin ETF net flows, 28 September to 16 October 2026
Over 4 weeks the pattern is apparent. Inflows of $2.39B, then $241M, then outflows of $679M and $228M. Two weeks of selling have taken out about $907M, or just over a third of the late-September buying.
Snapshot Spot ETF net flows minus $228M (previously minus $679M). Stablecoin supply $306.4B, a 2% decrease. |
What it means: Selling is slowing, but not reversing. A week of net buying would be the first sign the funds are back. A third week of outflows would turn this into a trend.
We were unable to read exchange flows in time for this issue.
Exchange balance and net flow come from CryptoQuant, and this week's reading was not taken. That matters, because last week showed the first net inflow to exchanges in our records, at 1,246 coins on 13 October. Both readings will return next week.
Snapshot Exchange balance and net flow not available. Last reading: 2.681M BTC on 13 October. |
What it means: In the absence of exchange data, holder and profit data carry more weight in determining whether coins are being lined up for sale.
Profit kept leaking this week, but much more slowly. The share of all Bitcoin held at a profit fell to 69.3% from 71.6% last week. That's a 2.3-point drop, compared to a 7-point drop last week. Coins purchased above ~$82,000 are now in the red.
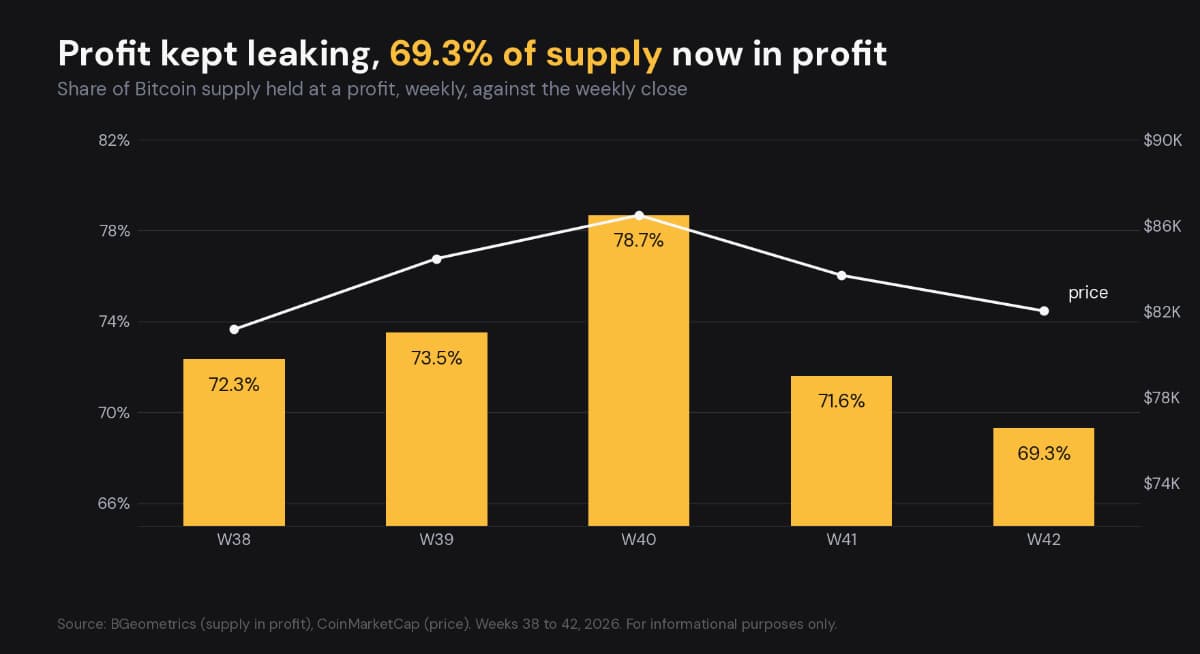
Share of Bitcoin supply held at a profit, weekly, against the weekly close
Long-term holders (LTH), coins that have not moved in roughly 155 days, cut their supply for a third straight week, by another 29,000 BTC to 14.45 million. That is less than half of last week's 76,000 BTC cut. Short-term holders (STH) scooped up those coins, bringing their total to 5.648 million.
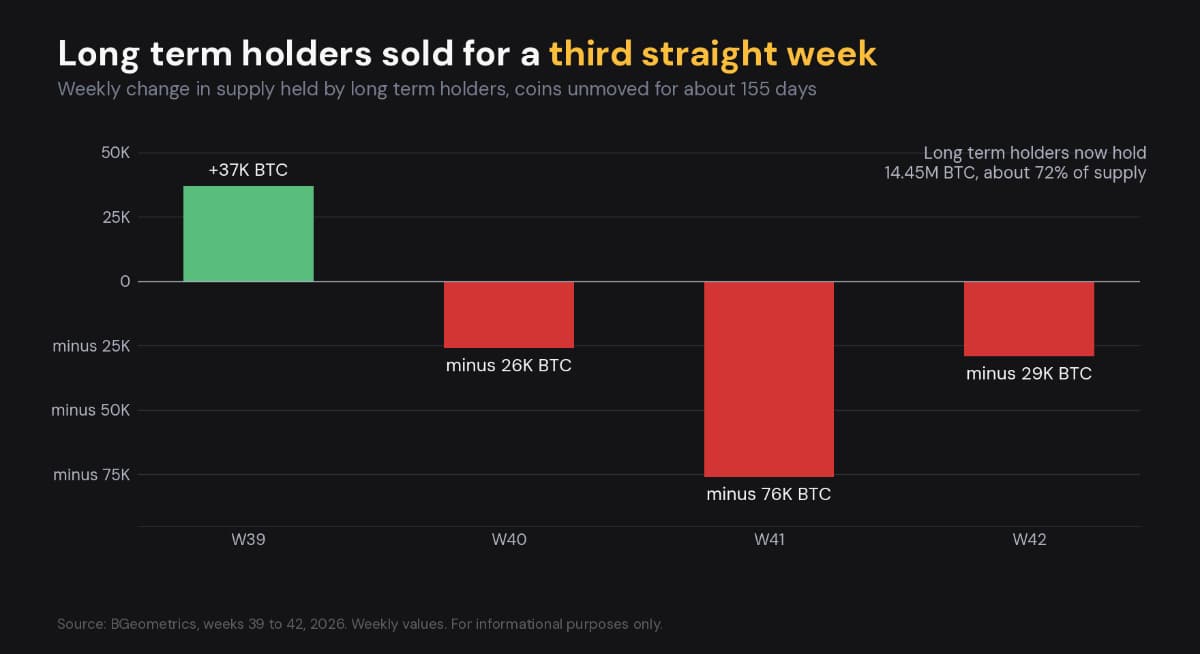
Weekly change in long-term holder supply
The MVRV ratio eased to 1.52 and the NUPL to 0.341. MVRV indicates the market is valued 52% above the average purchase price, and about a third of the total value of all BTC is in paper gains. SOPR is the number that moved. It fell from 1.0069 to 1.0009. Last week, the sellers were still in profit; this week, they sold at almost exactly what they paid.
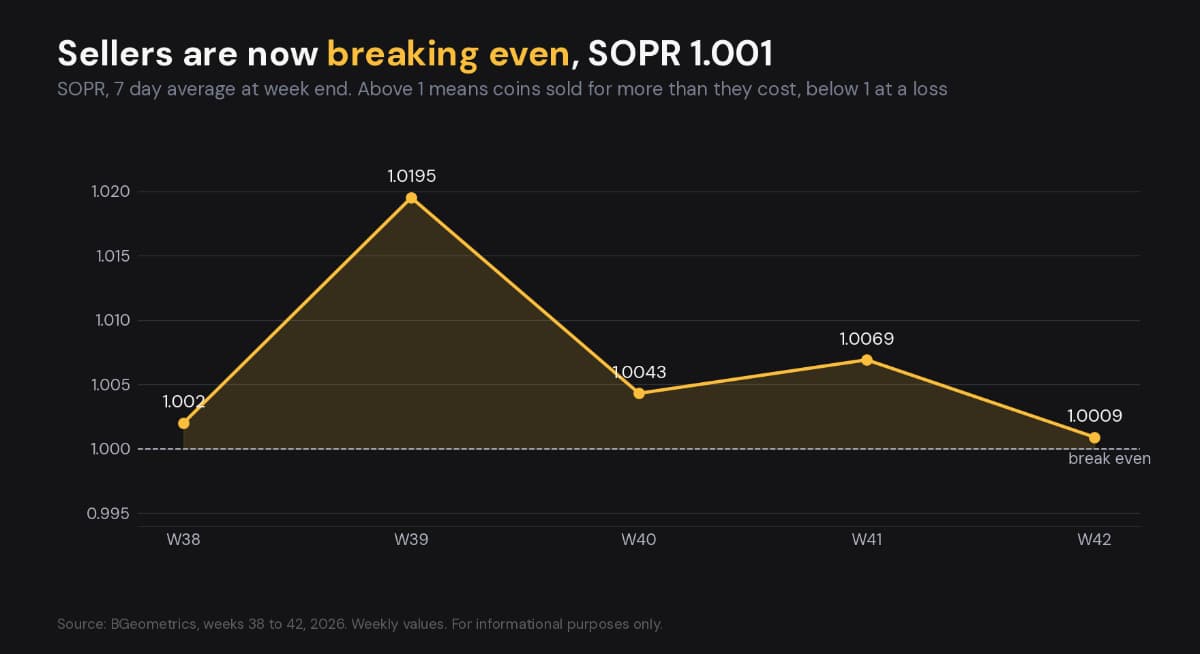
SOPR, 7-day average, weekly
Snapshot Supply in profit 69.3% (from 71.6%). MVRV 1.52, NUPL 0.341, SOPR 1.0009. |
What it means: A SOPR reading near 1 is a turning point. Sellers have little profit left to take, which can mark exhaustion. A move below 1 would mean holders are selling at a loss, the first real sign of stress in this series.
Leveraged buyers once again paid the price for this week's inflation surprise.
This week $213 million worth of long contracts were liquidated, compared to $79 million of short contracts. Last week, $237 million worth of long contracts and $56 million of short contracts were liquidated. The funding rate was once again cheap at 0.0038% every 8 hours, which is far below the 0.01% neutral rate, so traders are not paying a premium to bet on a rise.
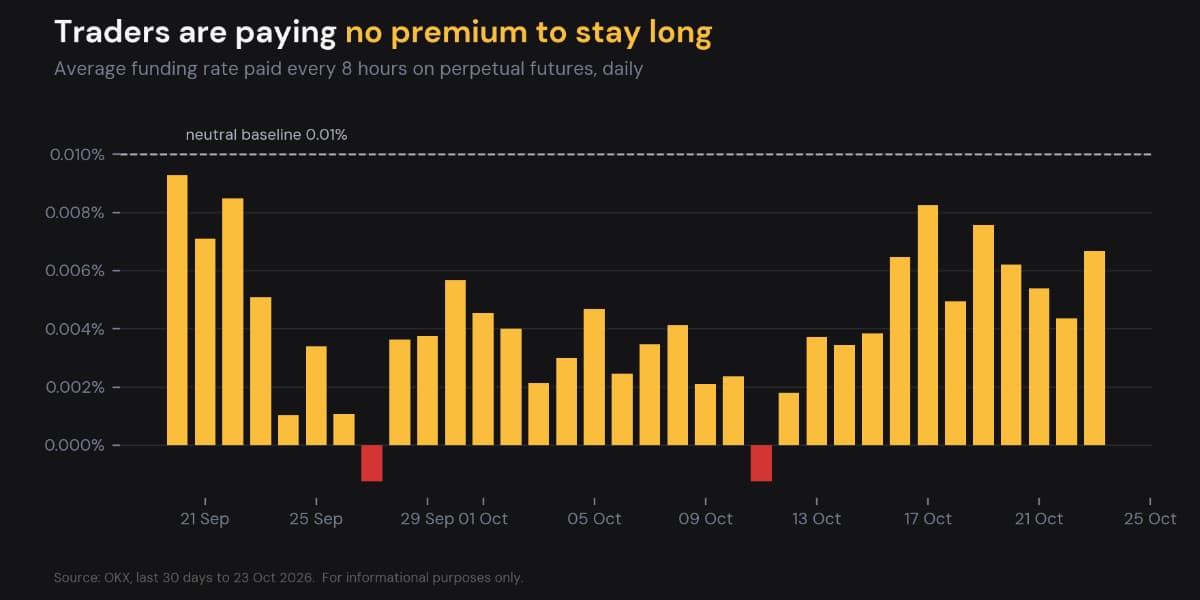
Average funding rate on perpetual futures, daily
Open interest data needs caution this week. BGeometrics puts total open interest in Bitcoin futures at $32.7 billion. This is measured differently from the $52.0 billion CoinGlass figure in last week's issue, so the two cannot be compared. Open interest on OKX alone held steady near $3.3 billion.
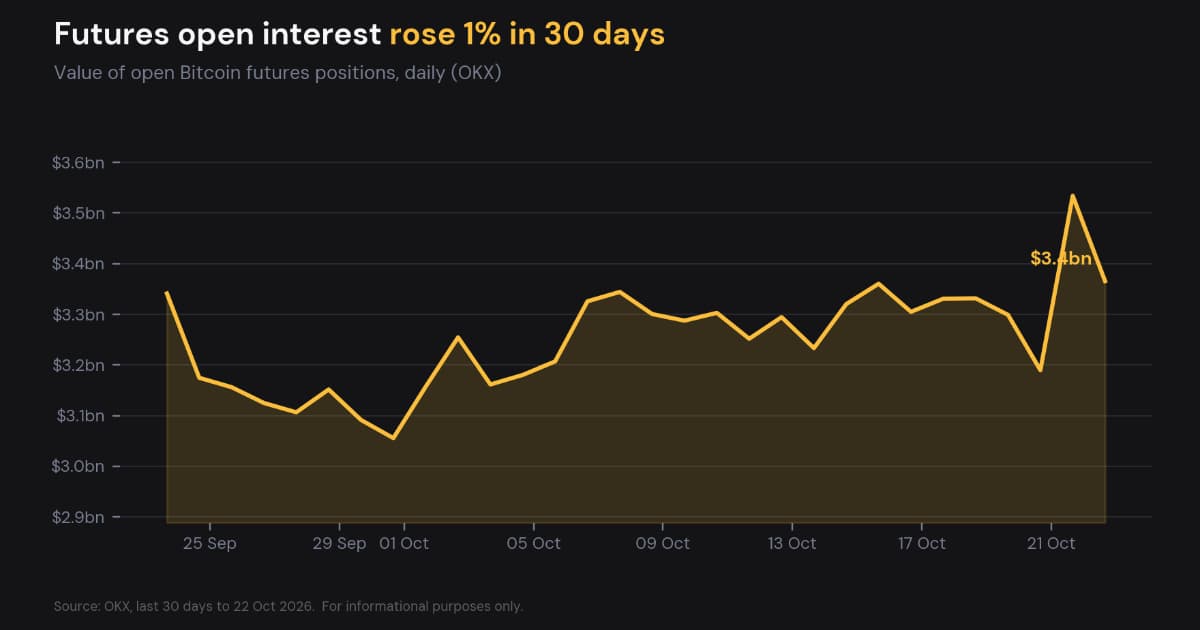
Bitcoin futures open interest on OKX, last 30 days
What it means: Long flushes over the last two weeks have purged a lot of weak hands. That doesn't set direction, but it leaves fewer forced sellers if price dips again.
Options traders paid less for protection after the floor held.
The one-week 25-delta skew fell from +1.97 to +1.17. Puts still cost more than calls, but the fear premium shrank. Implied volatility eased to 31.9% from 32.8%, and open interest rose to $32.3 billion.
Call bets sit well above the market, with the biggest blocks at $90,000, $95,000 and $100,000.
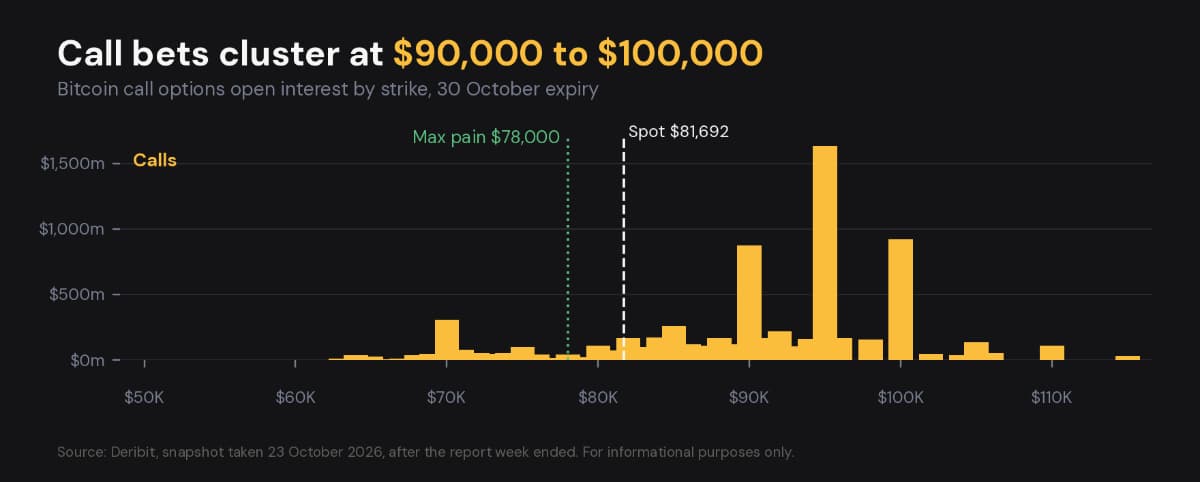
Bitcoin call options open interest by strike, 30 October expiry
Put protection is mainly between $65,000 and $75,000, with the biggest block at $70,000.
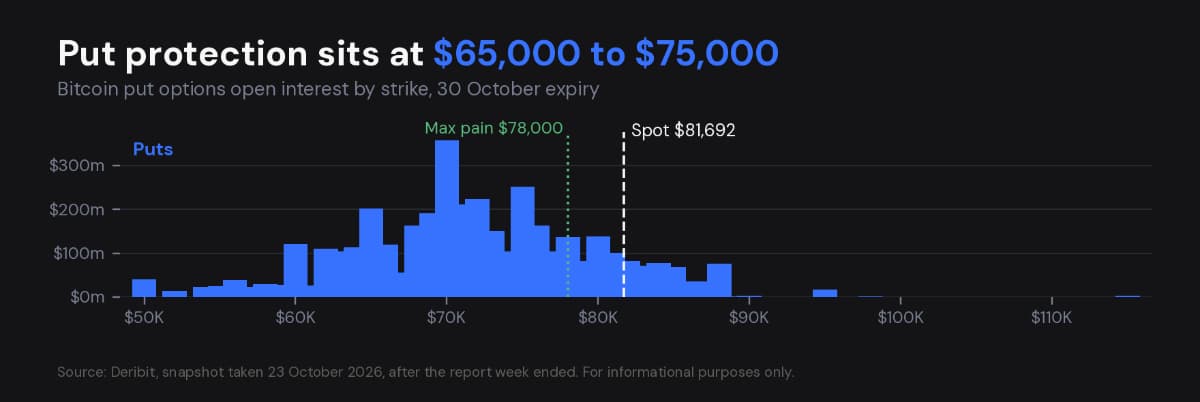
Bitcoin put options open interest by strike, 30 October expiry
Max pain for the 30 October expiry is now $78,000, just below the True Market Mean of $79,198. Once again, two different measures point to the same floor. The options data was taken on 23 October, after the week ended.
What it means: Cheaper protection after a test of support suggests traders see less risk of a deeper move down. The call wall at $90,000 is the first real test above.
Hash rate averaged 1,020 EH/s, a new high for this series, and difficulty increased by 5.92%. Miner revenue slipped 2.9% to $276.7 million as transaction fees fell to $1.49 million. Active addresses increased by 0.6% to 440,191, and transactions decreased by 2.5% to 731,783 after last week's record.
We've added the NVT Signal to the tracker this week, as promised. This indicator compares the market capitalisation of Bitcoin with the value transacted on-chain, similar to a price-to-earnings ratio. It currently sits at 24.5, inside its usual range.
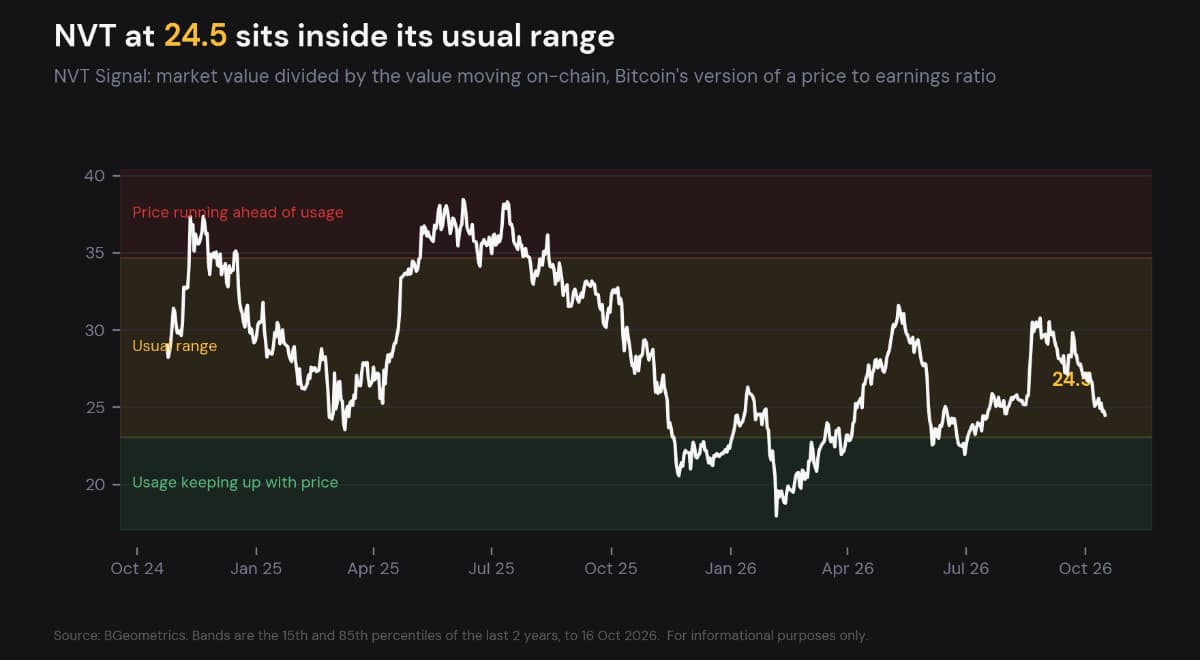
NVT Signal with usual range bands
What it means: More hash rate and less revenue squeeze miner margins, and squeezed miners sometimes sell coins. Network use, though, is keeping up with price.
Last week, macro conditions weren't the cause. This week, they were. September core inflation came out at 2.6% and headline at 3.7%, both above forecasts. With the Fed at 3.75% to 4.00%, the real policy rate slipped to 1.40%. On 16 October, Fed Chair Kevin Warsh declined to signal a hike, and the odds of an October hike fell below 15%. The 10-year US Treasury yield eased to 5.09% (from 5.24%) and the US Dollar Index slipped to 101.84.
What it means: Higher rates make non-yielding assets like Bitcoin less attractive. The FOMC meets on 27 and 28 October, and a surprise hike would likely test the floor again.
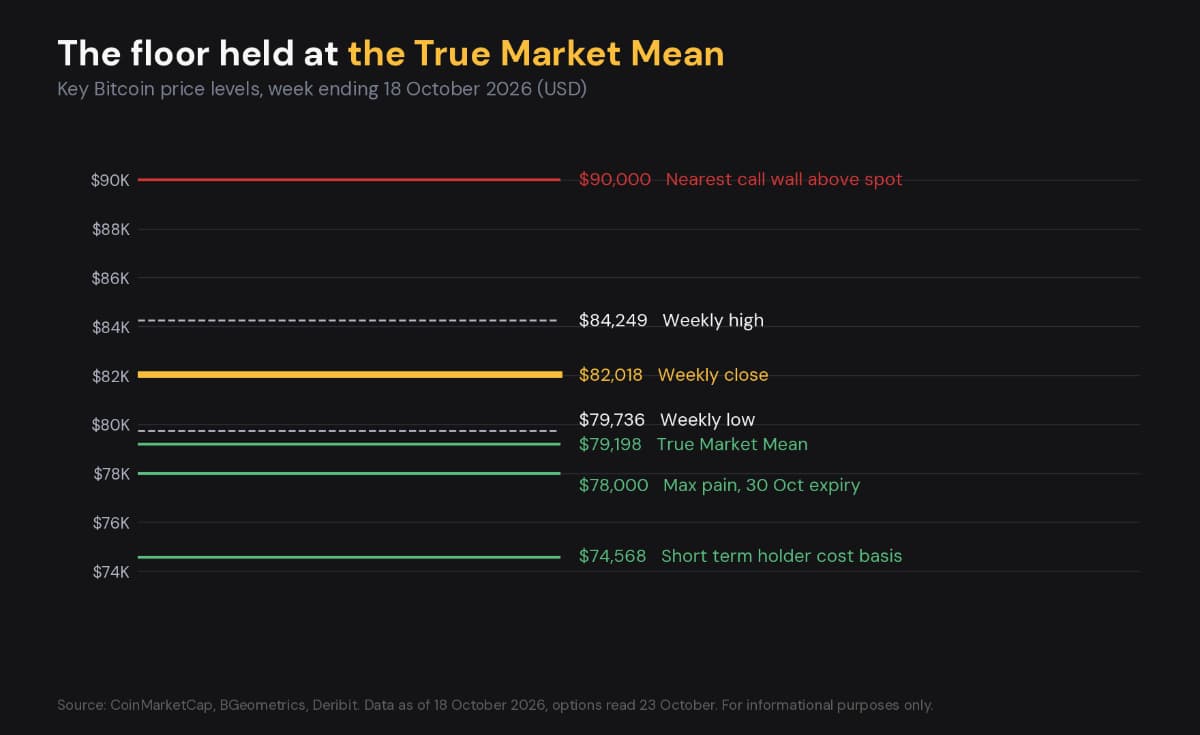
Key Bitcoin price levels, week ending 18 October 2026
| Level | Price | Why it matters |
|---|---|---|
| Resistance | $90,000 | Nearest heavy block of call options above spot |
| Resistance | $84,249 | This week's high, below last week's $86,972 |
| Weekly close | $82,018 | |
| Support 1 | $79,736 | This week's low, tested on 14 October |
| Support 2 | $79,198 | True Market Mean, with max pain at $78,000 just below |
| Support 3 | $74,568 | Short-term holder cost basis, up from $74,327 |
| Scenario | Trigger | Next level |
|---|---|---|
| Bull case | ETF buying returns and price reclaims $84,249 | $90,000 and the call wall |
| Base case | Price holds between $79,198 and $84,249 while flows stay negative | Range, with the floor tested again |
| Bear case | Weekly close under $79,198 | $74,568, where short-term holders break even |
Bull case: if ETF buying returns and price reclaims $84,249, the next key level is $90,000 and the call wall.
Base case: price stays in the range between $79,198 and $84,249 while flows stay negative, and the floor gets tested again.
Bear case: a weekly close below $79,198 opens $74,568, where short-term holders break even.
In rupee terms Bitcoin closed near ₹77.9 lakh at about ₹95 to the dollar, down from about ₹81 lakh a week earlier. The rupee was about 2% stronger over the week, so Indian holders lost about 3.8%, nearly double the 2% fall in dollars.
Tax is the same. Gains from Virtual Digital Assets (VDAs, the legal term for crypto, tokens and NFTs) are taxed at a flat 30% plus 4% cess, and 1% TDS is deducted by the exchange on transfers. Selling ₹5 lakh of Bitcoin means ₹5,000 is withheld at the time of sale. The rates were unchanged in Budget 2026, and the Income-tax Act, 2025 governs transactions from 1 April 2026.
A second consecutive down week means one point is worth repeating. Losses on VDAs cannot be offset against any gains, not even gains on other crypto, and they cannot be carried forward. An investor who bought a single Bitcoin at the end of last week and sold it this week would have lost approximately ₹3.1 lakh, with no tax benefit from the loss.
Corporate treasury purchases and the treasury average entry are missing for a fifth straight week. Net flow and exchange balance will return next week. We will also settle on a single source for futures open interest, so week-on-week comparisons can resume.
Sources and dates. Price, market cap and dominance from CoinMarketCap (daily closes, 12 to 18 October 2026). Network activity, fees and miner revenue from Token Terminal. Cost basis, holder supply, SOPR, supply in profit and Realized Cap from BGeometrics (18 October). Liquidations, futures open interest and NVT Signal from BGeometrics (weekly sum and week-end values, read 23 October). Hash rate from mempool.space. ETF flows from Farside Investors (12 to 16 October). Macro from the Federal Reserve, BLS, FRED and the US Treasury. Options from Deribit, snapshot 23 October, after the week ended. Funding and the futures chart from OKX. Exchange data not read this week. Rupee rates are reference rates for 10 and 16 October.
India Crypto Research operates independently. The information presented herein is intended solely for educational and informational purposes and should not be construed as financial advice. Before making any financial decisions, it's essential to undertake your own thorough research and analysis. If you're uncertain about any financial matters, we strongly recommend seeking guidance from an impartial financial advisor.


