Ethereum, Near-Record ETF Inflows, Staking kept climbing through the month, a Wall at $2,500, and a Close Near $2,419
ETF inflows never went negative in the last week
Staking kept climbing through the month
What's still working underneath the chop


 Part of a series
ETH cleared $2,500 for two sessions midweek, got sent firmly back below it, then failed a second attempt to reclaim it. Real institutional demand sits underneath the chop. Here's the whole week, day by day.
ETH closed Monday at $2,482.86, then slipped to $2,442.63 on Tuesday, down 1.62%. This came right after one of Ethereum's strongest weeks in years, the token had rallied close to 30% over the prior seven days on the same broad market move that pushed bitcoin toward $80,000. Futures open interest had climbed to roughly $32.5 billion by Tuesday, up about 20% over the prior month, a sign leverage was building alongside the rally.
ETH broke back above $2,500, closing Wednesday at $2,506.89, up 2.63%, and Thursday at $2,510.91, its high close for the week.
ETH gave back the week's gains in one session, closing at $2,442.70, down 2.72%. This lined up with the same broad risk-off move that hit bitcoin and BNB that day.
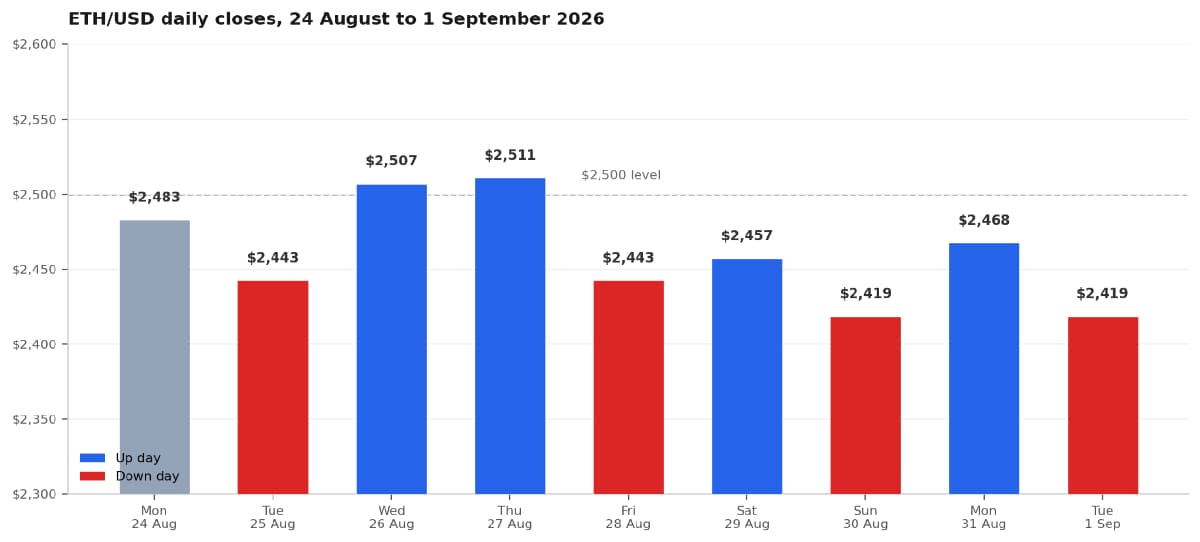
ETH's daily closes across the week, 24 August to 1 September 2026. Built from verified data points cited in Investing.com, CoinGecko, Fortune and CoinStats reporting.
ETH recovered slightly Saturday, closing at $2,457.19, up 0.59%, then slipped again Sunday to $2,418.59, down 1.57%, its low point of the week to that stage.
ETH bounced back to $2,467.65, up 2.03%, closing the gap toward $2,500 but not reclaiming it.
ETH closed at $2,418.58, down 1.99%, tying its Sunday low as the weakest close of the week. September opened with rising Fed rate-hike expectations weighing on the wider crypto market, the same repricing that kept bitcoin capped below $80,000 that day. ETH's own attempt to clear resistance had already failed days earlier, Thursday's intraday high of $2,559.63 marked the week's only real test of the $2,550 zone before sellers took over.
US spot Ethereum ETFs took in money every single trading day this week, extending a streak that reached 11 consecutive days on 31 August and 12 by 1 September, according to Farside Investors and SoSoValue data. Monday brought $115.6 million, then inflows climbed through the week to a peak of $225.8 million on Thursday, 27 August, the strongest single day since October 2025. Friday cooled to $102.1 million as the broader market wobbled, and the pace slowed further into the following week, $87.7 million on Monday 31 August and just $10.95 million on Tuesday 1 September. Slower isn't the same as negative, the streak never broke, even on the week's worst price days.
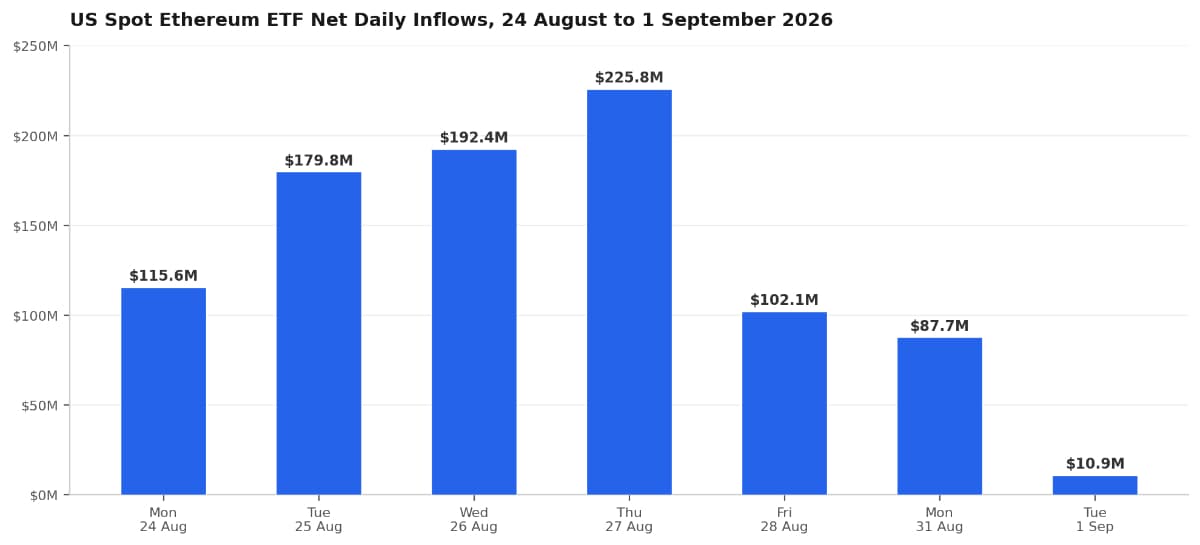
US spot Ethereum ETF net daily inflows, 24 August to 1 September 2026. Built from verified data cited in Farside Investors, SoSoValue, CryptoBriefing, KuCoin and CoinOTAG reporting.
Total ETH staked rose from 41.27 million tokens on 1 August to 42.61 million by month-end, an increase of roughly 1.34 million ETH, worth about $3.3 billion at current prices. As a share of total supply, the staking ratio climbed to roughly 35.0% by month-end, up from just under 34% earlier in August, according to COINOTAG and The Block. That's coins locked into the network earning yield rather than sitting on exchanges ready to sell, part of the same supply-tightening picture as the exchange-balance decline covered below.
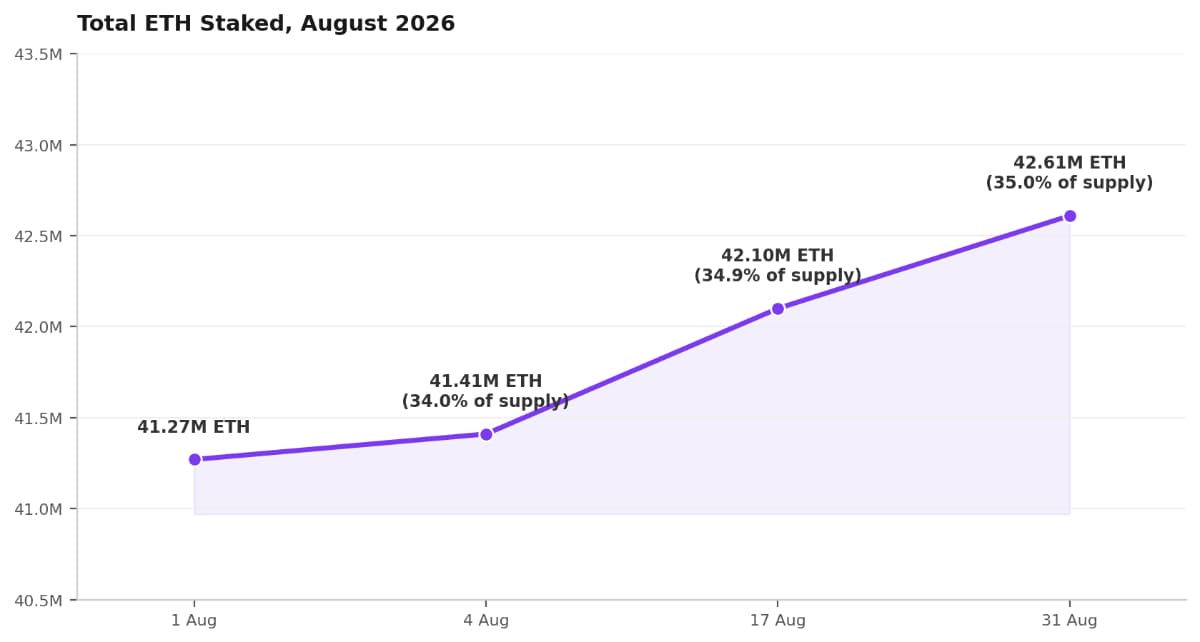
Total ETH staked and staking ratio, August 2026. Built from verified data cited in COINOTAG, The Block, Coinpedia and Bitget reporting.
Exchange balances have fallen roughly 15% since early June, another sign of coins moving into longer-term hands rather than sitting ready to sell. None of that stopped the week-over-week price decline, but it's a different picture from a market where demand is actually drying up.
$2,500 is the level that defined the week. ETH closed above it twice, Wednesday and Thursday, and below it the other seven sessions. Resistance sits at $2,550, the zone Thursday's intraday high touched before reversing. Support sits near $2,355, with a deeper pullback zone flagged around $2,150 if that breaks.
India Crypto Research operates independently. The information presented herein is intended solely for educational and informational purposes and should not be construed as financial advice. Before making any financial decisions, it's essential to undertake your own thorough research and analysis. If you're uncertain about any financial matters, we strongly recommend seeking guidance from an impartial financial advisor.