
Who are long-term holders?
What is realized price?
How has the LTH realized price behaved since 2010?
What happened when the price touched it before?
What does the past year say about what comes next?
Where could the price land next?
Our prediction
What this means for readers

Where we stand. On 21 November 2026, Bitcoin traded at $57,588. That is 8% above the realized price of $53,253, 19% above the long-term holder realized price of $48,427 and 54% below the October 2025 peak of $124,824.
A rare level. Since 2015, Bitcoin has closed below long-term holder cost in only three bear markets: 2015, 2018 to 2019 and 2022. Each time, it had already fallen 72% to 78% from its peak and MVRV was below 0.9. Today MVRV is 1.08.
What came after. One year after each first touch, Bitcoin was 39% to 87% higher. Two years after, it was 250% to 313% higher.
Our prediction. Our backtested model gives a 15% chance of touching $48.4k within 30 days, 33% within 90 days and 46% within 180 days. A break below the overall realized price is now more likely than not within 90 days.

 Part of a series
Bitcoin has lost more than half its value in just over a year. On 21 November 2026, it traded at $57,588, down 54% from its peak of $124,824 on 6 October 2025. So how much further can it fall before the most patient money starts to feel the pain?
One on-chain number has marked that point in every bear market since 2015: the long-term holder realized price. Its latest reading, for 19 November, was $48,427.
Every bitcoin carries a record of the last time it moved on the blockchain. Analysts use that record to split the supply into two groups. Coins that moved within the last 155 days belong to short-term holders (STH), mostly new buyers and active traders. Coins that have not moved for 155 days or more belong to long-term holders (LTH).
Glassnode set the 155-day line because coins held this long rarely get spent. The split describes coins, not people, so one person can own both kinds. A coin’s clock also resets to zero the moment it moves. The two groups trade places through a cycle, as the graphic below shows.
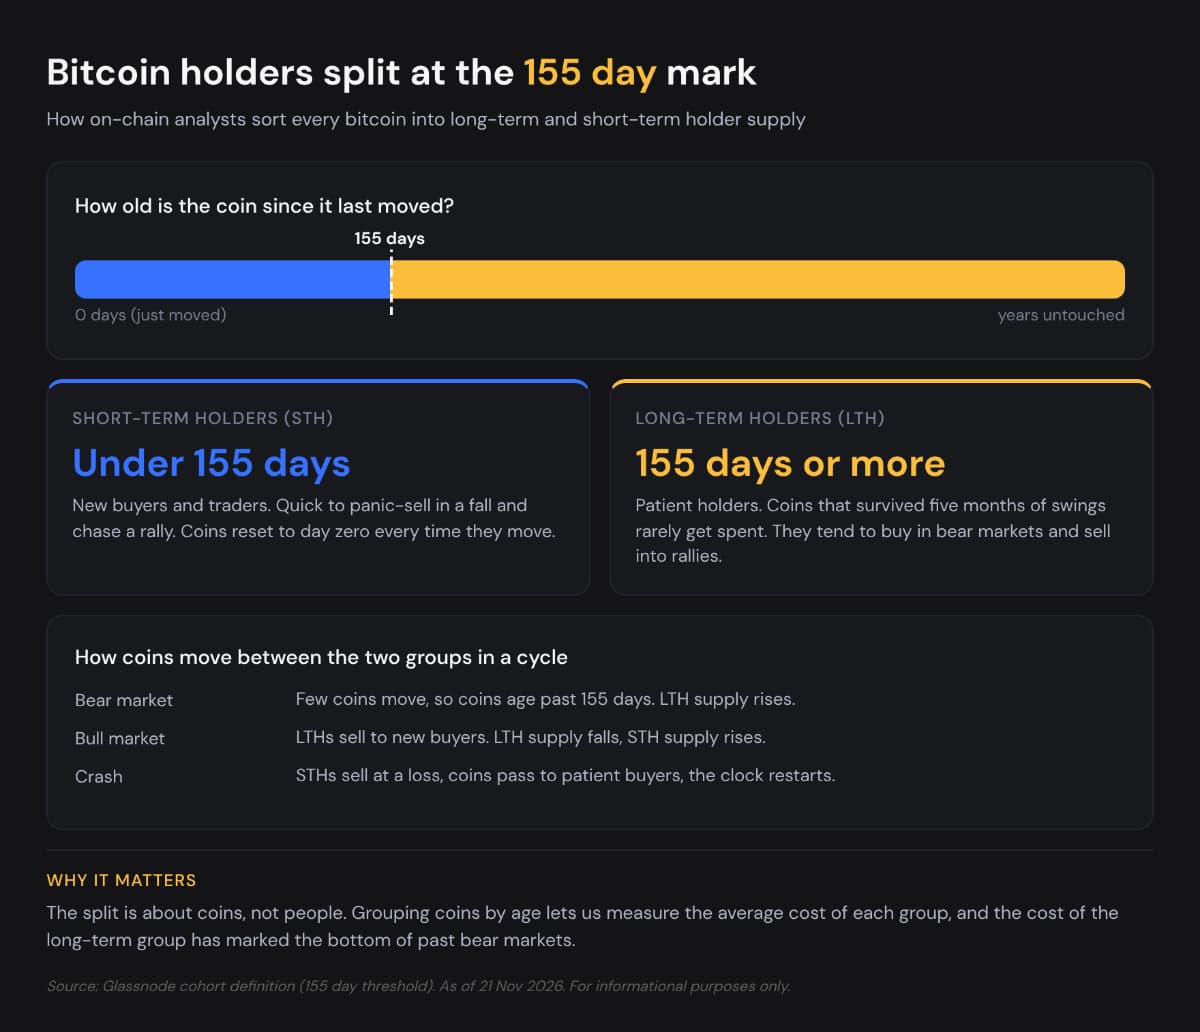
Figure 1. How bitcoin supply is split into short-term and long-term holders. Source: Glassnode cohort definition. As of 21 Nov 2026.
Market cap values every coin at today’s price, even coins lost years ago. Realized price takes a different route. It values each coin at the price on the day it last moved, adds them up to get the realized cap, and divides that by the number of coins. In plain terms, it is the average price holders actually paid.
Dividing price by realized price gives MVRV (market value to realized value). Above 1, the average holder is in profit. Below 1, the average holder is at a loss. The LTH realized price runs the same sum on long-term holder coins only, so it shows the cost base of the most patient money in the market. The example below works through the arithmetic with three made-up coins.
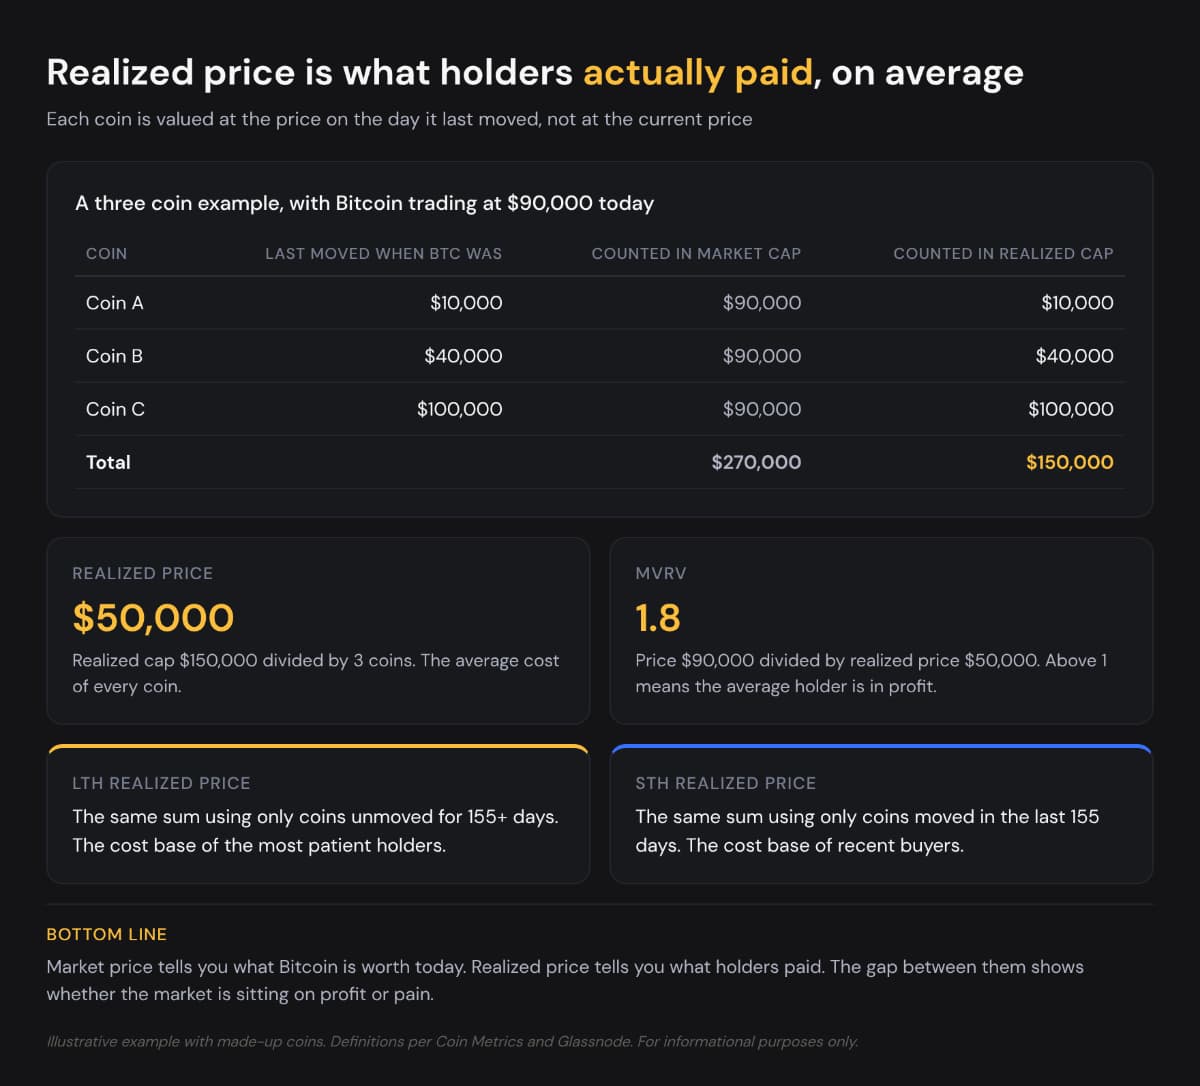
Figure 2. How realized price, MVRV and LTH realized price are calculated. Illustrative example.
The chart below tracks the Bitcoin price against its realized price since 2010. The red bands mark times when the price fell below it and the average holder was at a loss.
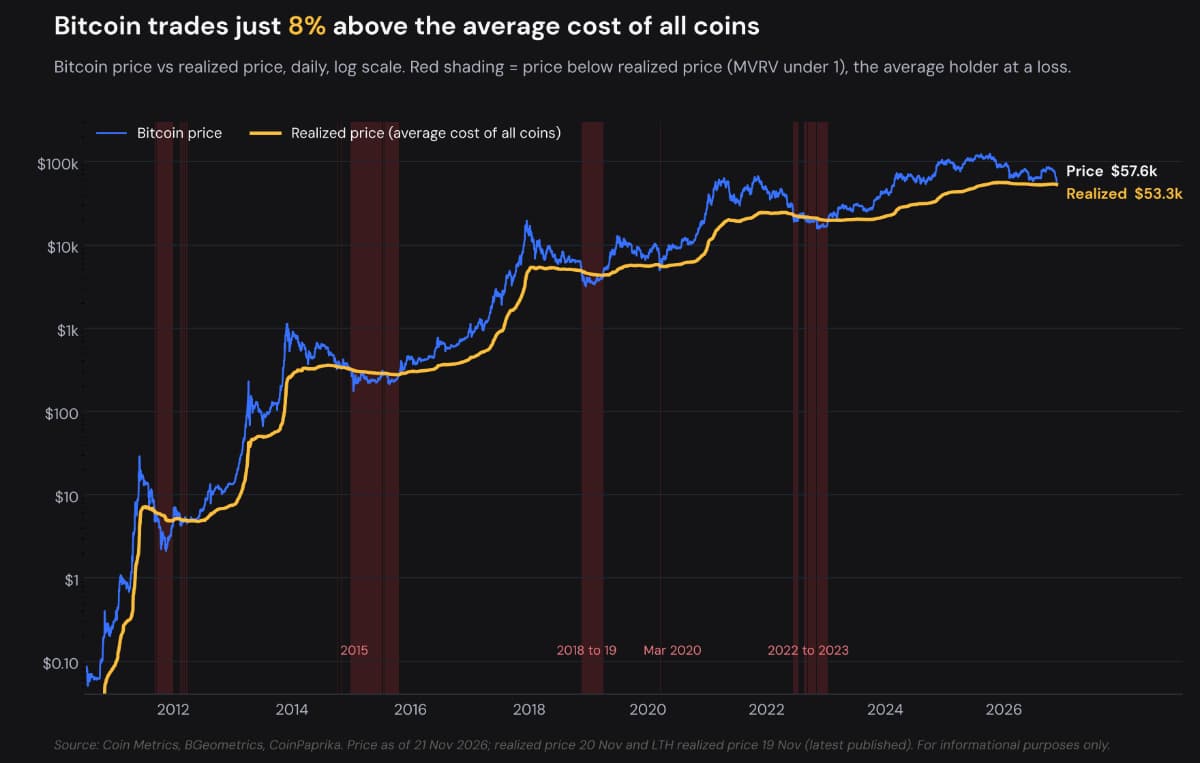
Figure 3. Bitcoin price vs realized price, daily, log scale. Source: Coin Metrics, BGeometrics, CoinPaprika. Price as of 21 Nov 2026; realized price 20 Nov.
Every major bear market ended with the price below this line: 2015, late 2018, briefly in March 2020, and 2022. On 21 November, the price was only 8% above it, the thinnest cushion since March 2023.
The chart below plots the Bitcoin price from July 2010 against its overall realized price and the LTH realized price, which our source publishes from 2012.
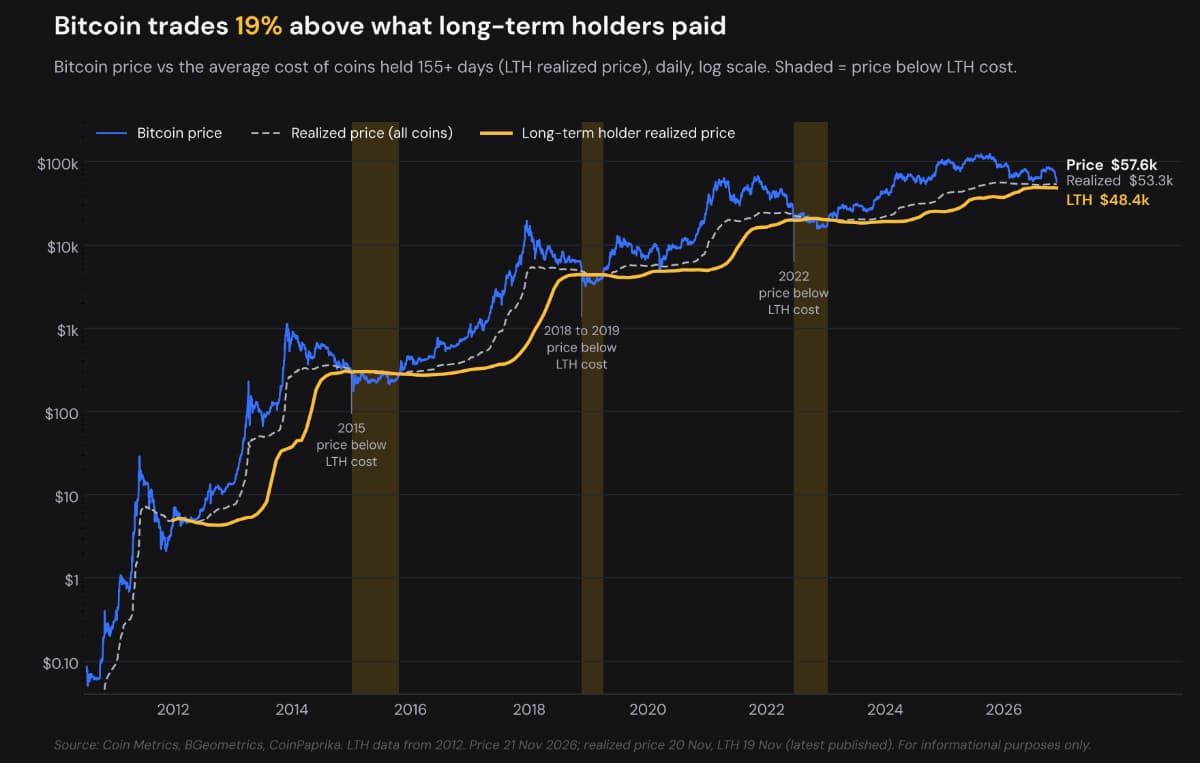
Figure 4. Bitcoin price, realized price and LTH realized price, daily, log scale. Source: Coin Metrics, BGeometrics, CoinPaprika. Price as of 21 Nov 2026; LTH realized price 19 Nov.
Three things stand out. First, the price spends most of its life well above the gold line. Second, it has dropped below that line in only three bear markets since 2015, shaded on the chart. A fourth came close: on 12 March 2020, during the COVID crash, Bitcoin closed at $4,959, just 2.4% above the LTH cost of $4,843. Third, the line itself moves. It climbs in bull markets, as old, cheap coins are sold and newer, pricier coins age into the long-term group.
That third point matters now. The LTH realized price rose from $37,238 at the start of 2026 to about $49,000 by midsummer, as coins bought during the 2025 rally crossed the 155-day mark. Since June, it has held between $48,100 and $49,300.
The table below lists each past touch, the MVRV reading that day, how long the price stayed below and what came next. The highlighted row shows 21 November.
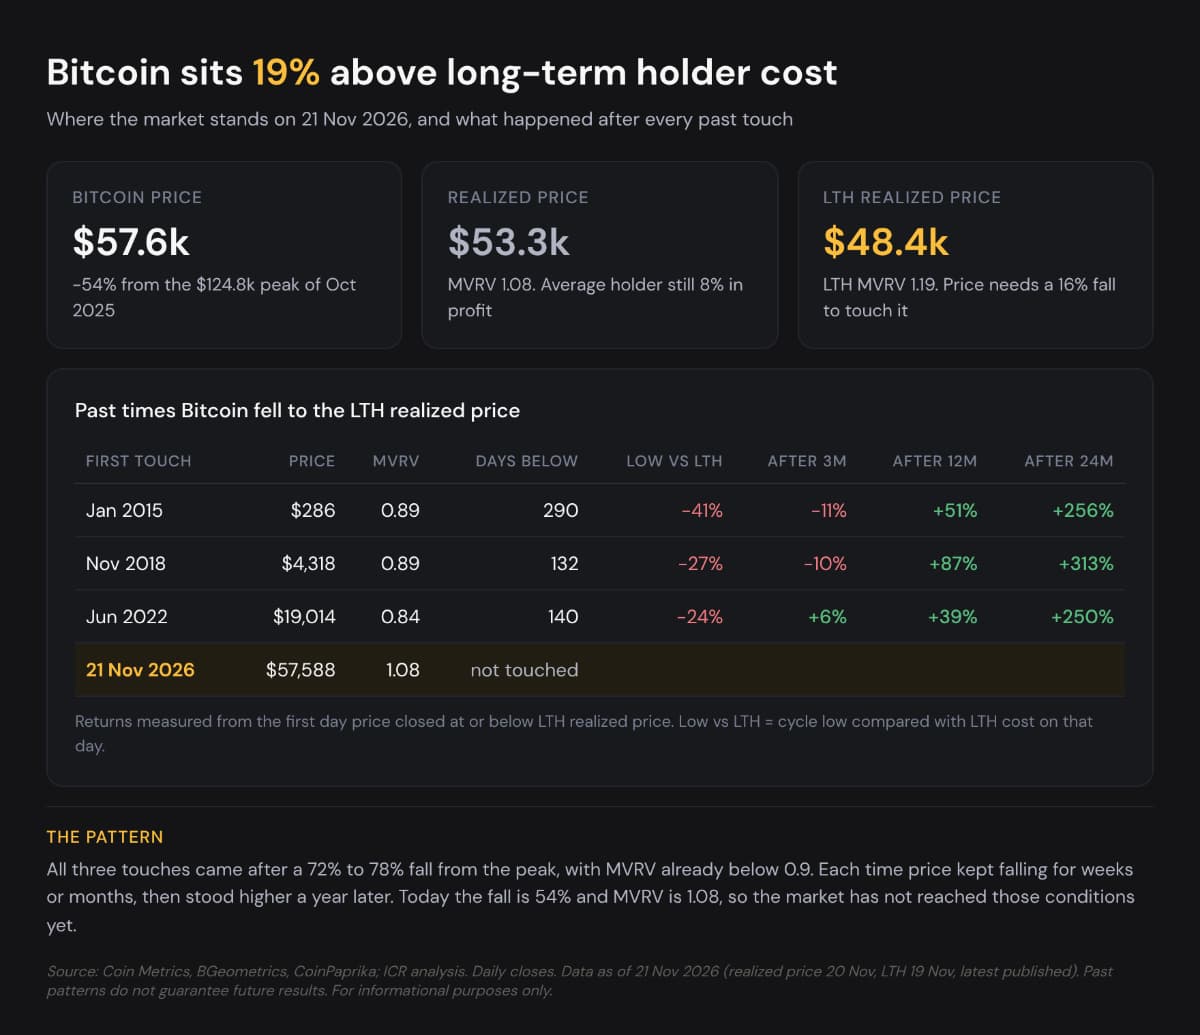
Figure 5. Market levels on 21 Nov 2026 and outcomes after past touches of the LTH realized price. Source: Coin Metrics, BGeometrics, CoinPaprika; ICR analysis.
The pattern is consistent but rough. The price did not bounce cleanly off the line. It stayed below for 132 to 290 days and sank another 24% to 41% under LTH cost before finding its low. Three months after the first touch, returns ranged from −11% to +6%. A year later, all three were higher, and two years later, all three had more than tripled.
The MVRV chart below marks each first touch.
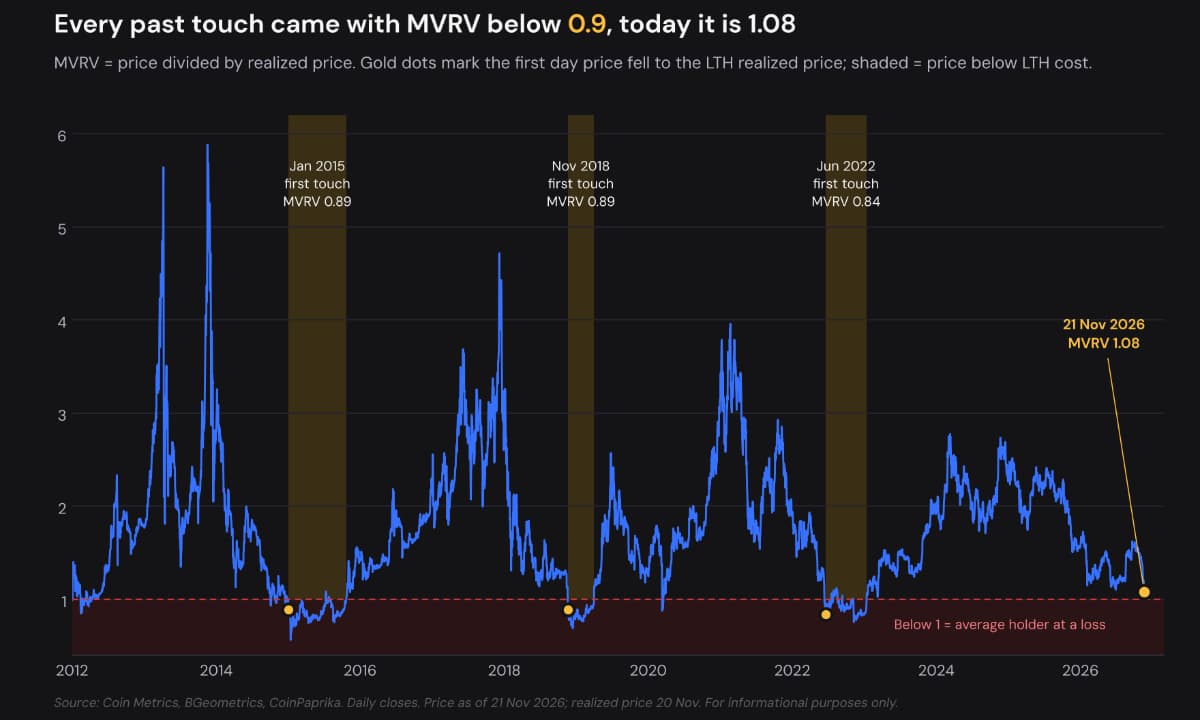
Figure 6. MVRV since 2012 with first touches of the LTH realized price marked. Source: Coin Metrics, BGeometrics, CoinPaprika. Price as of 21 Nov 2026; realized price 20 Nov.
Every past touch came with MVRV between 0.84 and 0.89. So the price first fell below the overall realized price, putting the average holder at a loss, and only then reached long-term holder cost. On 21 November, MVRV was 1.08, so the average holder was only 8% in profit.
Two cautions apply. Three episodes is a small sample. And this cycle looks different: the drawdown so far is 54%, against 72% to 78% in past cycles. That fits a market now holding more ETF and institutional money, so patterns built on retail-driven cycles may not repeat on the same scale.
The chart below shows the last twelve months of price, realized price and LTH realized price, with MVRV underneath and the model’s next 90 days of paths shaded on the right.
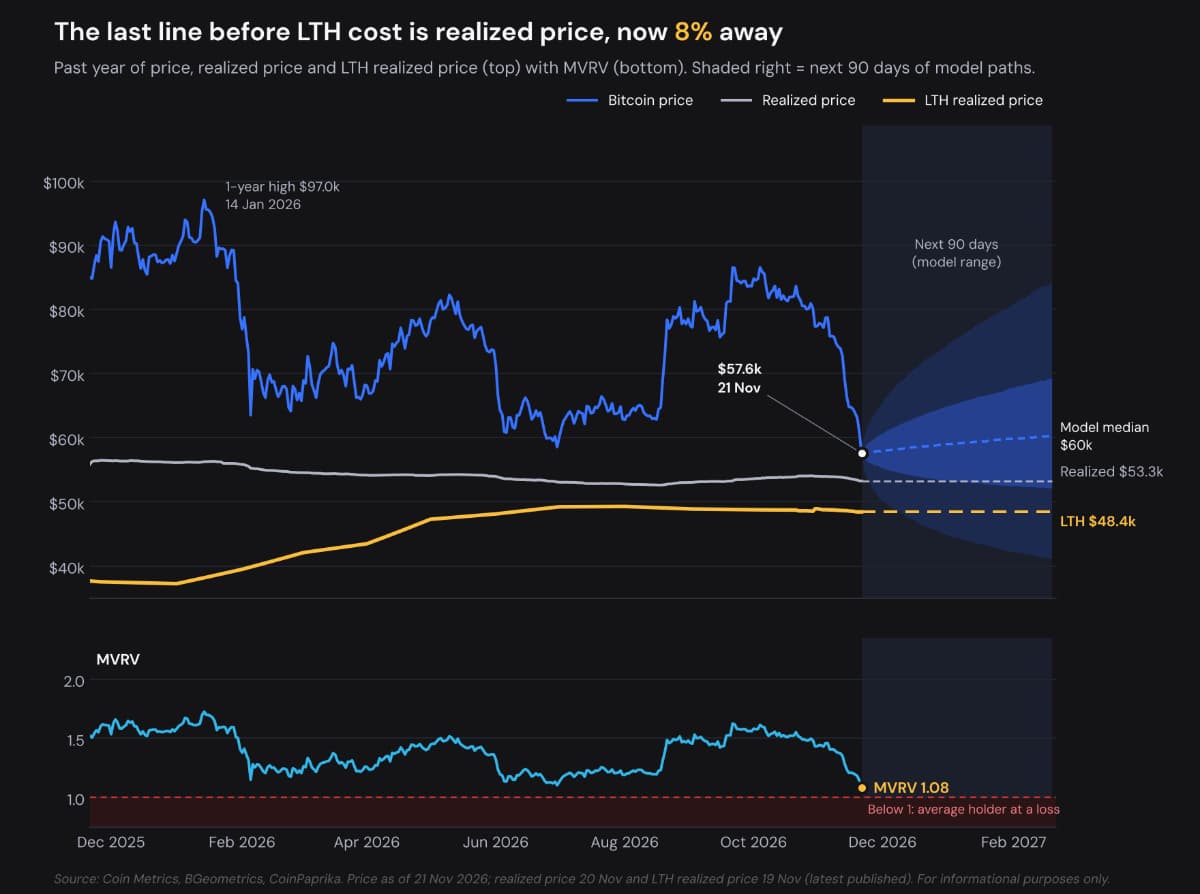
Figure 7. Past year of price, realized price and LTH realized price, with MVRV, plus the 90-day model range. Source: Coin Metrics, BGeometrics, CoinPaprika; ICR analysis. Price as of 21 Nov 2026.
Three levels now sit close together. The realized price sits 8% below the $57,588 price, and LTH cost sits 16% below it. MVRV has fallen from 1.5 in October to 1.08, its lowest since March 2023. The June low of $58,525 held above realized price. This time the cushion is thinner, so the next leg lower would likely test realized price first.
To put odds on the move, we built a Monte Carlo model, which simulates thousands of possible price paths and counts how many reach each level.
The model averages two methods. The first replays random ten-day chunks of actual Bitcoin returns from the past two years, keeping its real mix of calm stretches and crashes. The second, a GARCH filtered historical simulation, lets volatility rise and fall with market stress and adds a small upward drift equal to half of Bitcoin’s four-year average return. On 21 November, it put current volatility at about 53% a year, well above the two-year average of 43%.
Before trusting the model, we tested it. We ran it on 5,392 past forecasts between 2018 and 2026, each using only the data available at the time, and it scored best of all the versions we tried. When it said 30%, the drop happened 25% of the time. When it said 50%, it happened 48% of the time.
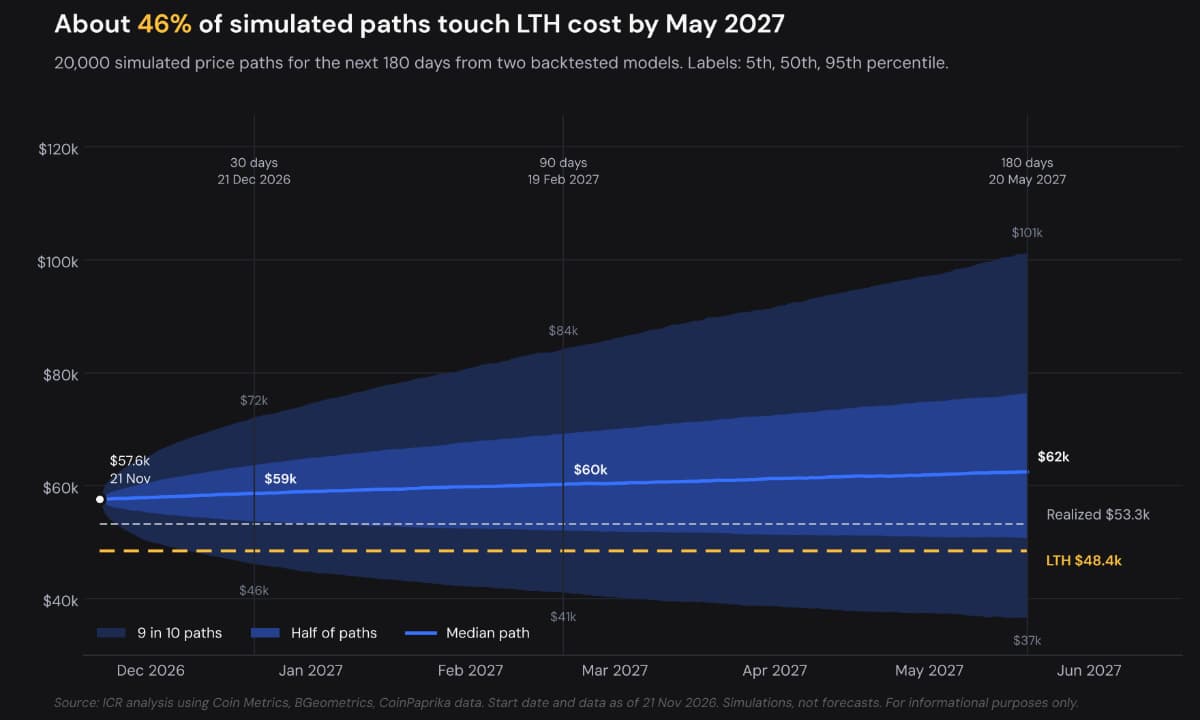
Figure 8. 20,000 simulated price paths from 21 Nov 2026 to 20 May 2027. Source: ICR analysis. Simulations, not forecasts.
The middle path drifts from $57,588 to about $62,000 by May 2027, but the spread is wide. Nine in ten paths end between $37,000 and $101,000. The graphic below turns those paths into odds for each key level.
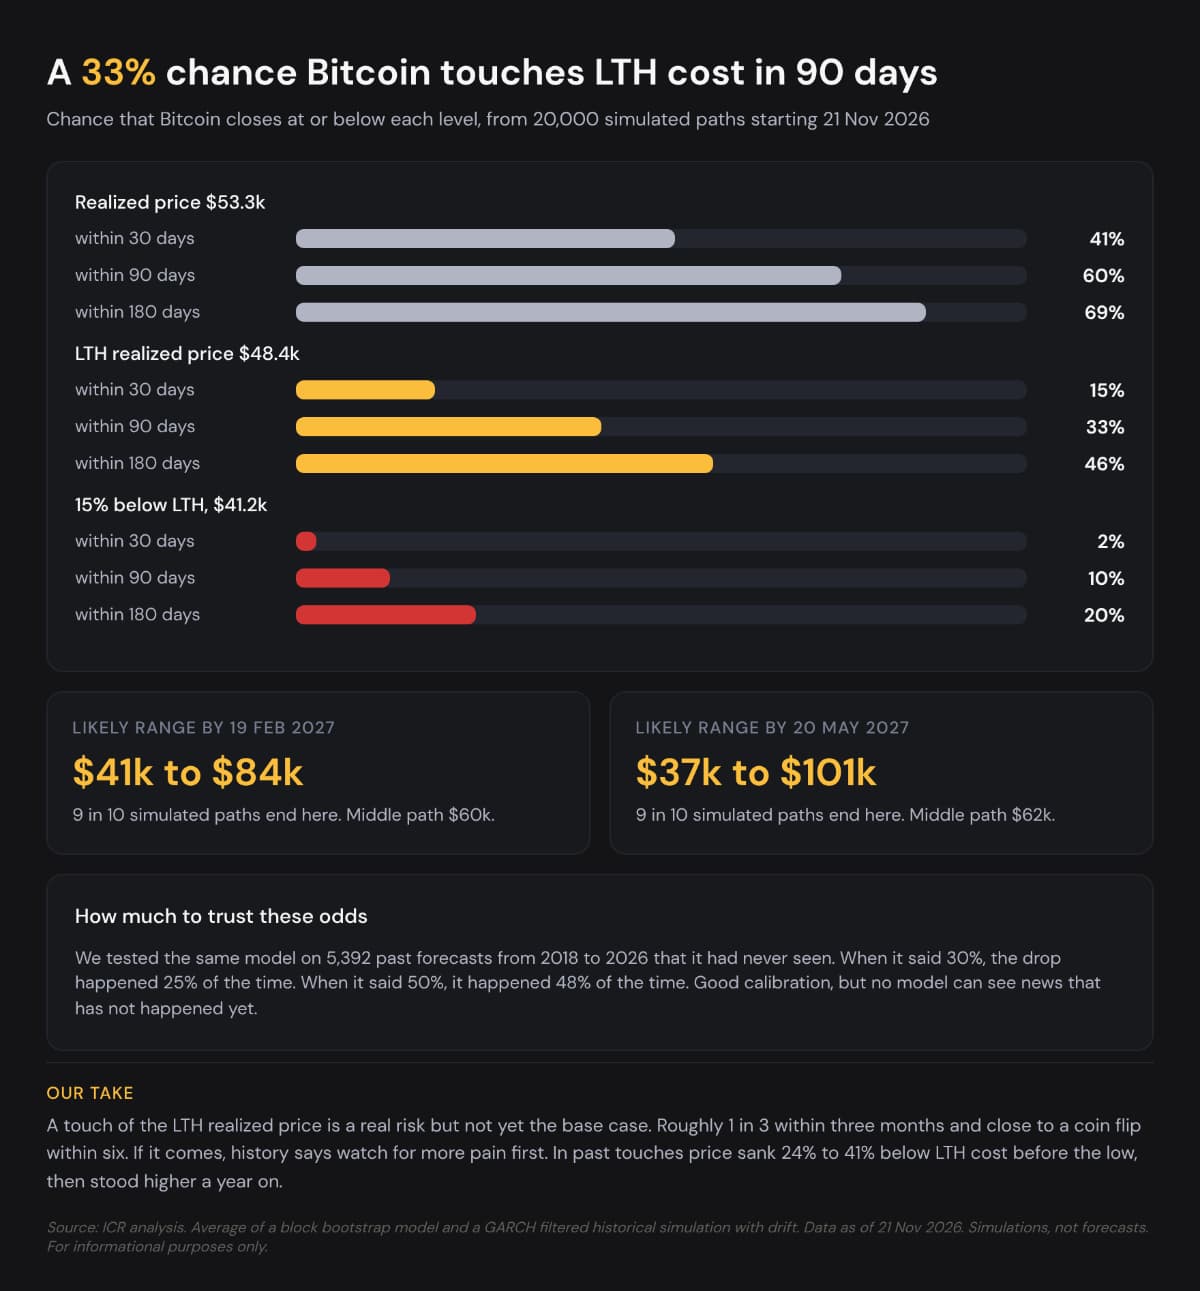
Figure 9. Chance that Bitcoin closes at or below each level within 30, 90 and 180 days of 21 Nov 2026. Source: ICR analysis.
Combining history and the model, this is our read as of 21 November 2026.
1. Base case, by a thin margin. Bitcoin holds above long-term holder cost over the next six months. Just over half of the simulated paths, 54%, never touch $48,427.
2. The nearer test is $53,253. That is the overall realized price, where MVRV hits 1, only 8% below today’s price. The model gives it a 41% chance within 30 days, 60% within 90 days and 69% within 180 days. In every past cycle, this break came before the LTH touch.
3. A touch of $48,427 is a real risk. The odds are 15% within 30 days, 33% within 90 days (by 19 February 2027) and 46% within 180 days (by 20 May 2027).
4. A deep undershoot is a tail risk. A fall to $41,163, 15% below LTH cost, carries a 10% chance within 90 days and 20% within 180 days.
The LTH realized price is a map of where the most patient holders start to feel pain, not a price target. Three signals are worth watching: MVRV slipping below 1, which means a price under about $53,250; the LTH realized price itself, which will keep moving as coins age; and whether long-term holders begin selling at a loss, which has marked capitulation in past cycles. A model can put odds on a fall. It cannot see the next policy decision, ETF outflow or liquidation wave.
Methodology: Touches are measured on daily closes. Realized price is to 20 Nov and LTH realized price to 19 Nov 2026, the latest published, carried forward to 21 Nov. The model averages 10,000 block bootstrap paths and 10,000 GJR-GARCH filtered historical simulation paths, walk-forward tested on 2018–2026 data.
Sources: Coin Metrics community data (to 23 May 2026), BGeometrics and CoinPaprika (to 21 Nov 2026), Glassnode and ICR analysis.
India Crypto Research operates independently. The information presented herein is intended solely for educational and informational purposes and should not be construed as financial advice. Before making any financial decisions, it's essential to undertake your own thorough research and analysis. If you're uncertain about any financial matters, we strongly recommend seeking guidance from an impartial financial advisor.


