
What is SOPR, and why is it important?
Are Bitcoin investors selling at a profit or loss?
Can SOPR predict Bitcoin market bottoms?
The psychology behind Bitcoin profit-taking
Short-term vs long-term holders
Has Bitcoin ETF adoption affected SOPR?
What this means for you

SOPR compares the price a coin was sold at with the price it was last bought at. Above 1 means sellers made a profit. Below 1 means they took a loss.
As of 8 October 2026, Bitcoin’s SOPR stood at 1.008. Sellers are booking small profits, not big ones.
Long-term holders sold at a loss on 87 of the first 176 days of 2026, a pattern seen before only in bear markets and the March 2020 crash.
SOPR dropped below 1 near the 2018, 2020 and 2022 bottoms, but it has never named the exact day.
US spot Bitcoin ETFs hold about 6.3% of all Bitcoin. Their buyers trade fund shares, not coins, so some selling never shows up in SOPR.

Bitcoin soared to about $126,000 on 6 October 2025. By June 2026, it had fallen to near $60,000. Investors who bought near the top and sold in June took a loss, and that loss left a trace on the blockchain. SOPR reads that trace. As of 8 October 2026, with Bitcoin near $83,000, SOPR shows that sellers are only just breaking even.
The Bitcoin blockchain does not keep account balances. Instead, it keeps a record of coin chunks called UTXOs (Unspent Transaction Outputs), which work like individual currency notes in a wallet. Each chunk carries the date and price at which it last moved. When it is spent, it becomes a spent output.
SOPR (Spent Output Profit Ratio) was introduced by analyst Renato Shirakashi in 2019. It divides the price a coin was sold at by the price it was last acquired at, then averages the result across every coin that moved that day. A coin bought for ₹50 lakh and sold for ₹60 lakh has a ratio of 1.2. A coin bought for ₹80 lakh and sold for ₹72 lakh has a ratio of 0.9. A market reading of exactly 1 means the day’s sellers, on average, got back what they paid.
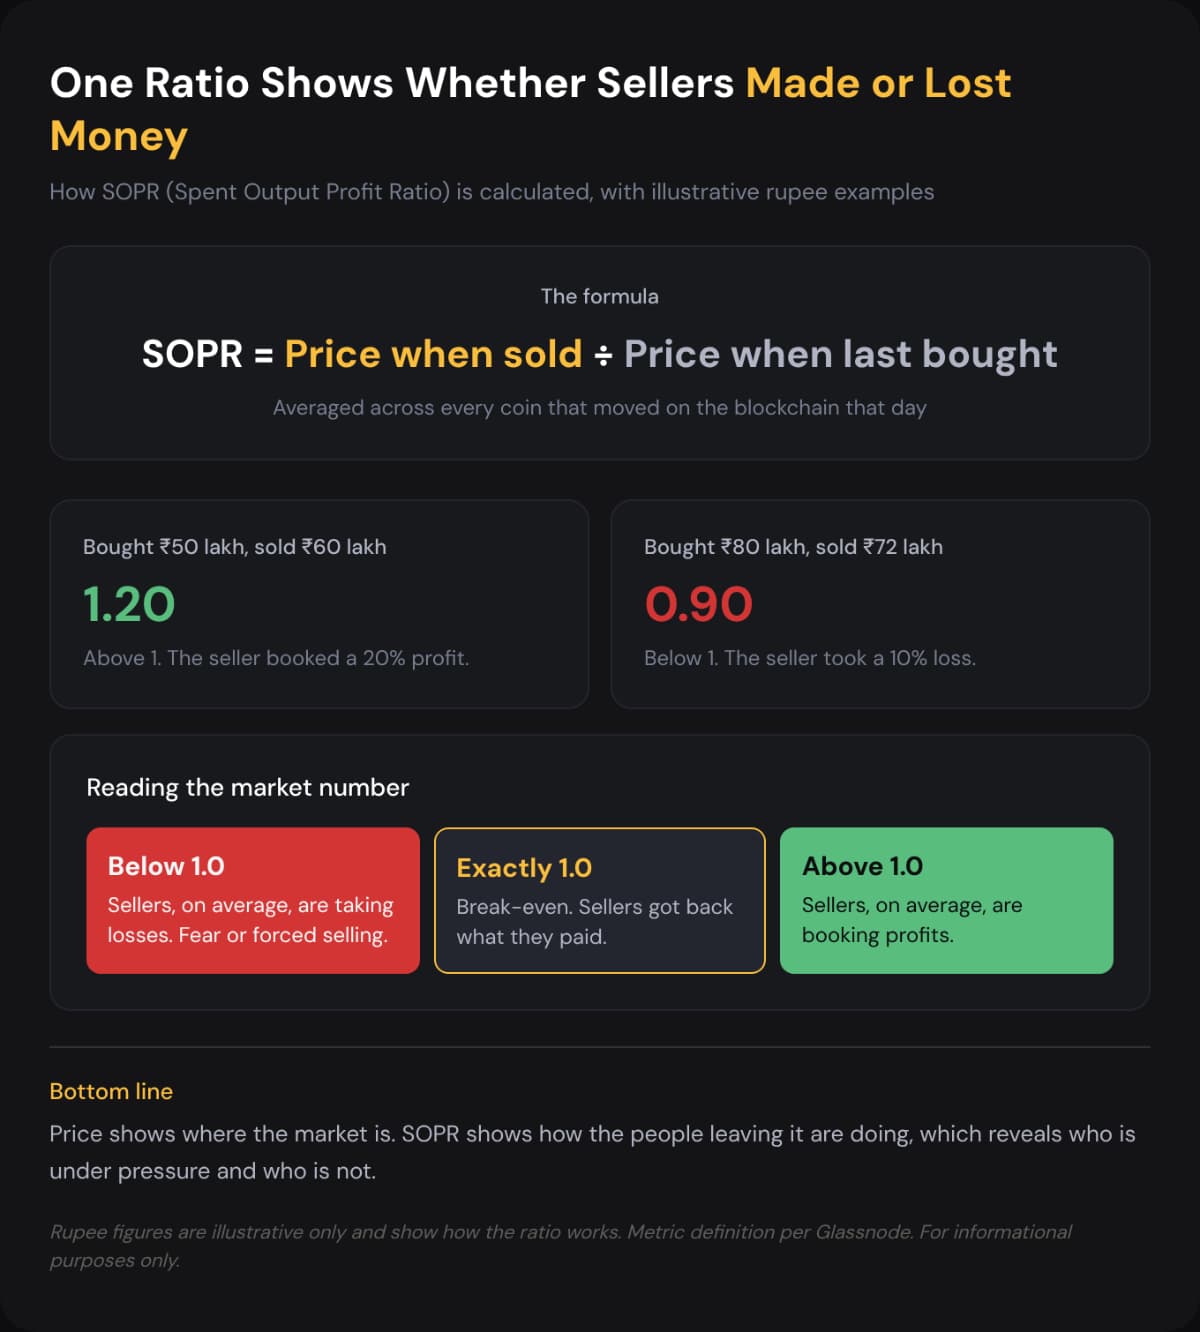
Price tells you where the market is. SOPR tells you how the people leaving it are doing, which shows which investors are under pressure and which are not.
A thin profit, for now. The overall SOPR was at 1.008 on 8 October 2026. CryptoQuant data showed it had stayed above 1 since 19 August, the longest profitable run of 2026 by early September.
The total hides a split. Long-term holders were selling at a reading of 1.13, a healthy profit. Recent buyers sat at 0.997 on 9 October, slightly under water. The chart below shows all three against the break-even line.
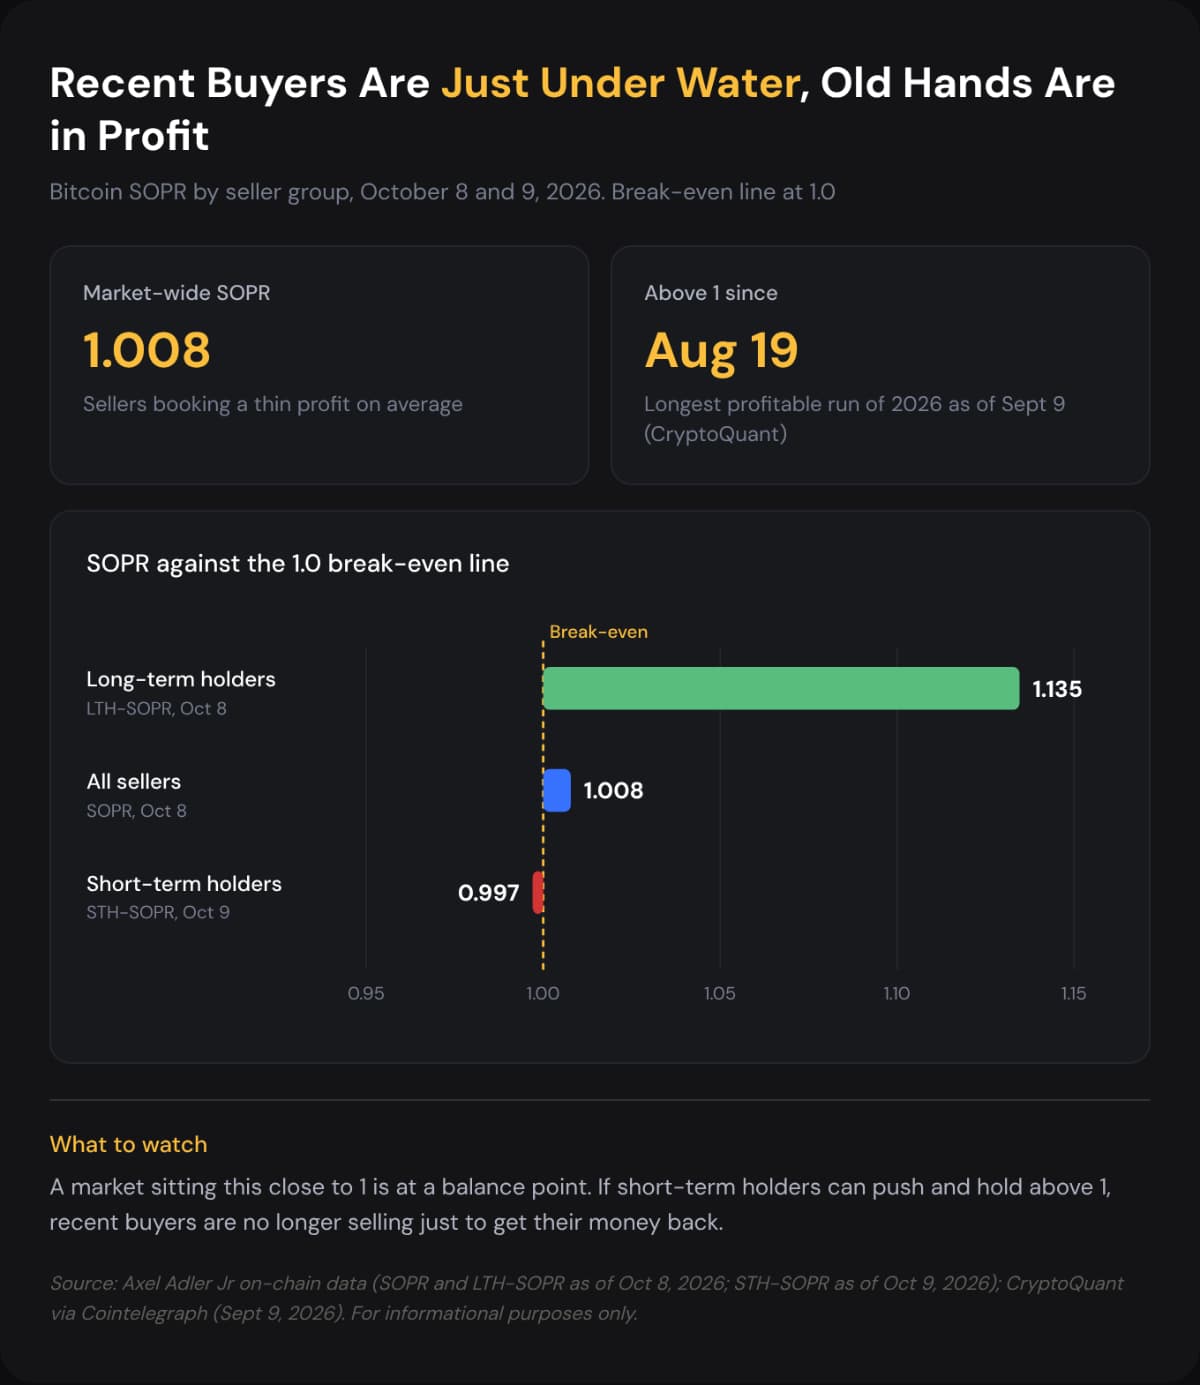
Source: Axel Adler Jr on-chain data. Data as of 8 and 9 October 2026.
SOPR readings this close to 1 describe a market at a balance point. Glassnode put Bitcoin’s realized profit-to-loss ratio, the value of profits booked against losses booked, at exactly 1.0 during the second week of September.
Past cycles suggest SOPR finds the neighbourhood of a bottom, not the exact address. Its 7-day average fell to 0.9416 at the end of the 2018 bear market and to 0.9486 in March 2020, when Bitcoin dropped below $4,000. On 14 November 2022, after the FTX collapse, it touched 0.9847 with Bitcoin hovering around $16,000. Each low came within weeks of a cycle bottom.
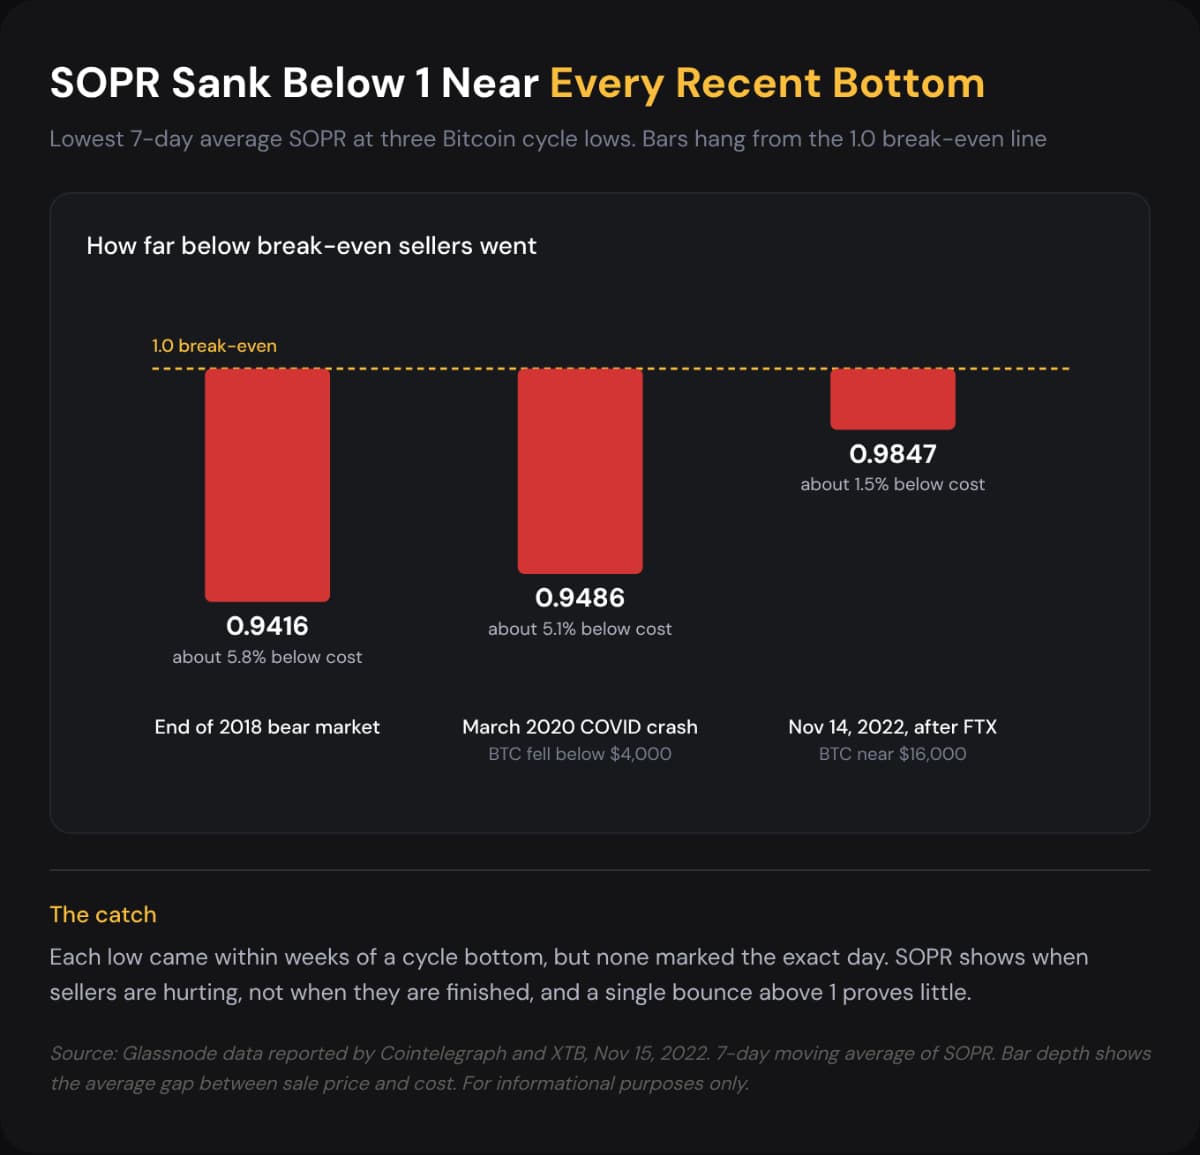
Source: Glassnode data reported by Cointelegraph and XTB, 15 November 2022. 7-day moving average.
2026 posted a rarer signal. Long-term holders, the most steadfast group in the market, sold at a loss on 87 of the first 176 days of the year, according to CryptoQuant data reported on 26 June. Their 30-day average fell to 0.88. A sustained 30-day average below 1 appeared in the 2015, 2018–2019 and 2022–2023 bear markets and in the March 2020 crash. It did not appear in 2017, 2021, 2024 or 2025.
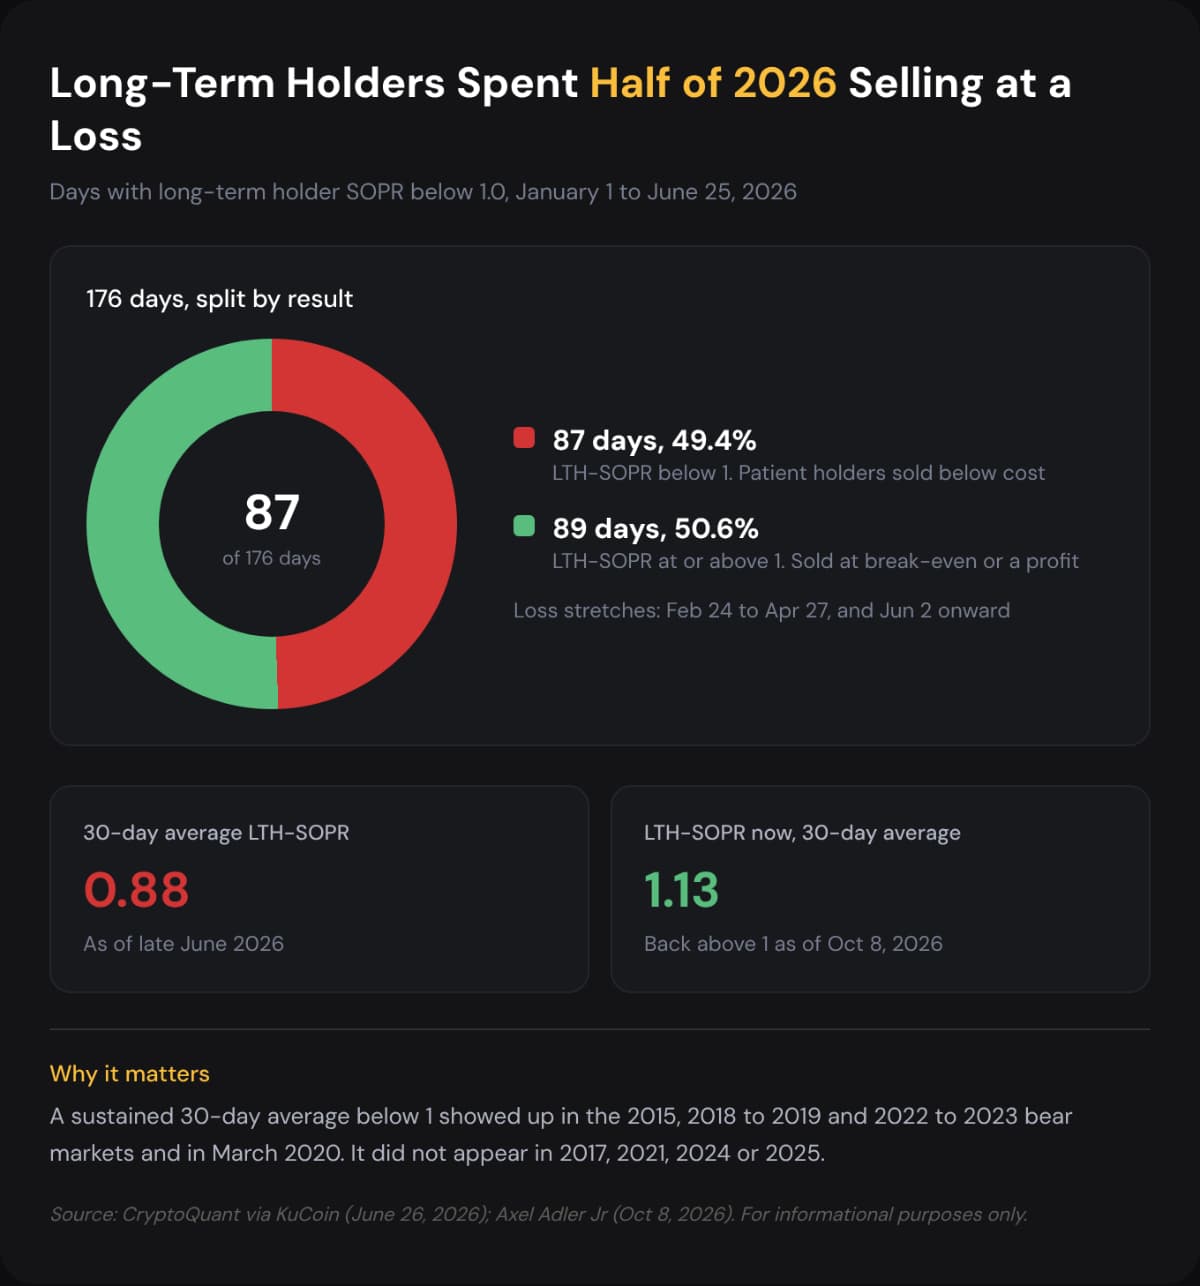
Source: CryptoQuant, via KuCoin. Days from 1 January to 25 June 2026.
There are two limits. SOPR shows when sellers are hurting, not when they are done. In 2023, the long-term holder average stayed below 1 for more than 100 days while the price was already rising. And one jump above 1 means little. David Puell of ARK Invest said in a 4 September CryptoQuant interview that SOPR must hold above 1 for an extended stretch without price making a new low, and that fresh lows remain possible this cycle.
SOPR is a behavioural measure dressed up as a ratio. Behavioural finance calls the underlying habit the disposition effect, described by Hersh Shefrin and Meir Statman in 1985. It is investors’ tendency to sell winners too early and hold losers too long, hoping to get back to what they paid.
That behaviour makes 1 a line people act around. In a bear market, price crawls back toward what recent buyers paid and they sell to get out even, so SOPR touches 1 and turns down. Checkonchain made the same observation in September, noting that bear market rallies back into profit tend to get sold. During a bull market, the opposite happens. Holders refuse to sell at a loss on dips, so SOPR bounces off 1.
The final stage of a sell-off is capitulation, when even the most patient holders give up and sell below cost. SOPR records this as a deep dip.
Analysts split holders at 155 days. Coins that have not moved for that long are statistically far less likely to move at all. Holders under the line are short-term holders (STHs), and those above it are long-term holders (LTHs).
As of June 2026, LTHs held approximately 16.64 million BTC, roughly 83% of circulating supply, according to Glassnode. The figure hit another record on 21 July.
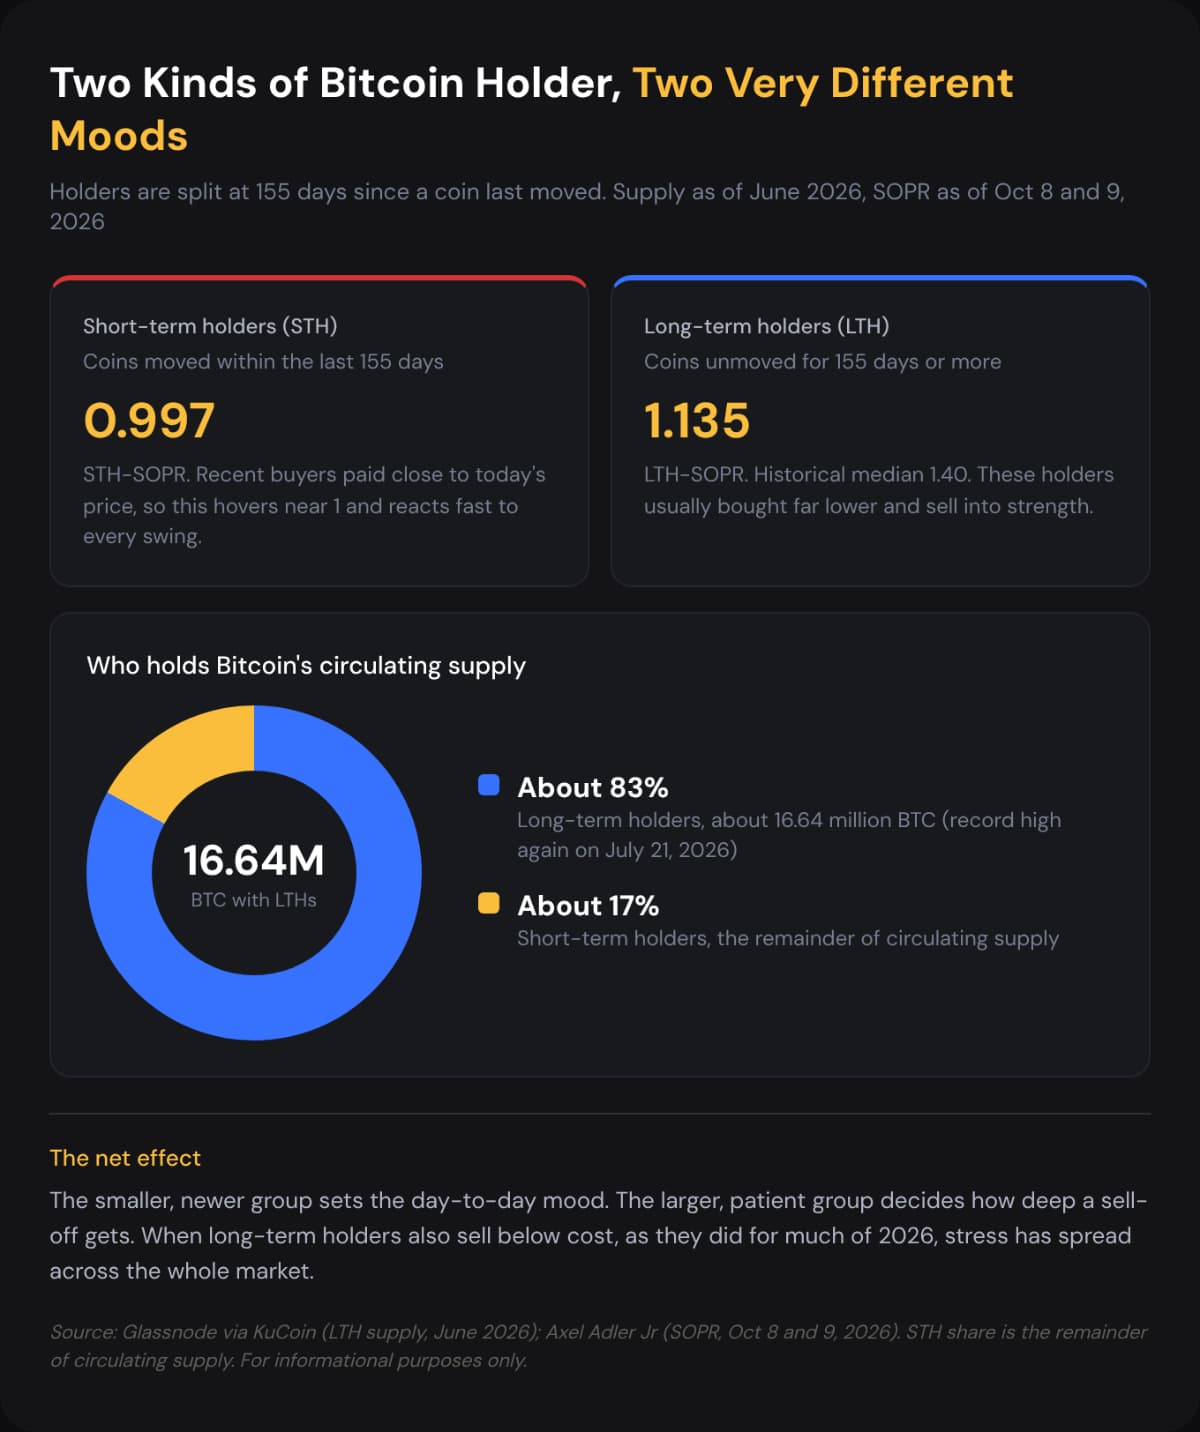
Source: Glassnode via KuCoin (supply, June 2026). Axel Adler Jr (SOPR, 8 and 9 October 2026).
The two groups read differently. STH-SOPR hovers near 1 because recent buyers paid close to today’s price. By contrast, LTH-SOPR usually runs far higher, with a historical median of 1.40, because these holders bought much lower. That is why the long-term holder losses of 2026 stood out. A likely reason is that coins bought during the 2025 rally above $100,000 aged past 155 days, and some owners then sold below cost.
Yes, mainly by making it harder to read. US spot Bitcoin ETFs (exchange traded funds that hold real Bitcoin and trade like shares) began trading on 11 January 2024. As of 19 September 2026, they were estimated to hold 1.27 to 1.32 million BTC, about 6.3% of supply.
There are three main ways ETFs change SOPR.
• Fund trades stay off-chain. An investor who sells ETF shares in a panic moves no coins. Only when the fund redeems shares does the custodian move Bitcoin, and then in bulk. Much of the retail fear in ETFs never reaches SOPR.
• Fund coins sit still and age. Coins in ETF custody cross 155 days and count as long-term holdings. In October 2024, Glassnode estimated that 4% to 5% of one supply measure was linked to ETF issuers.
• Selling migrated. LTH supply peaked at 16.4 million BTC in January 2024, just before the ETF launch. Holders then distributed nearly 2 million BTC in the months after, leaving 14.12 million BTC at the October 2025 price peak. The figure climbed back to 16.3 million by May 2026.
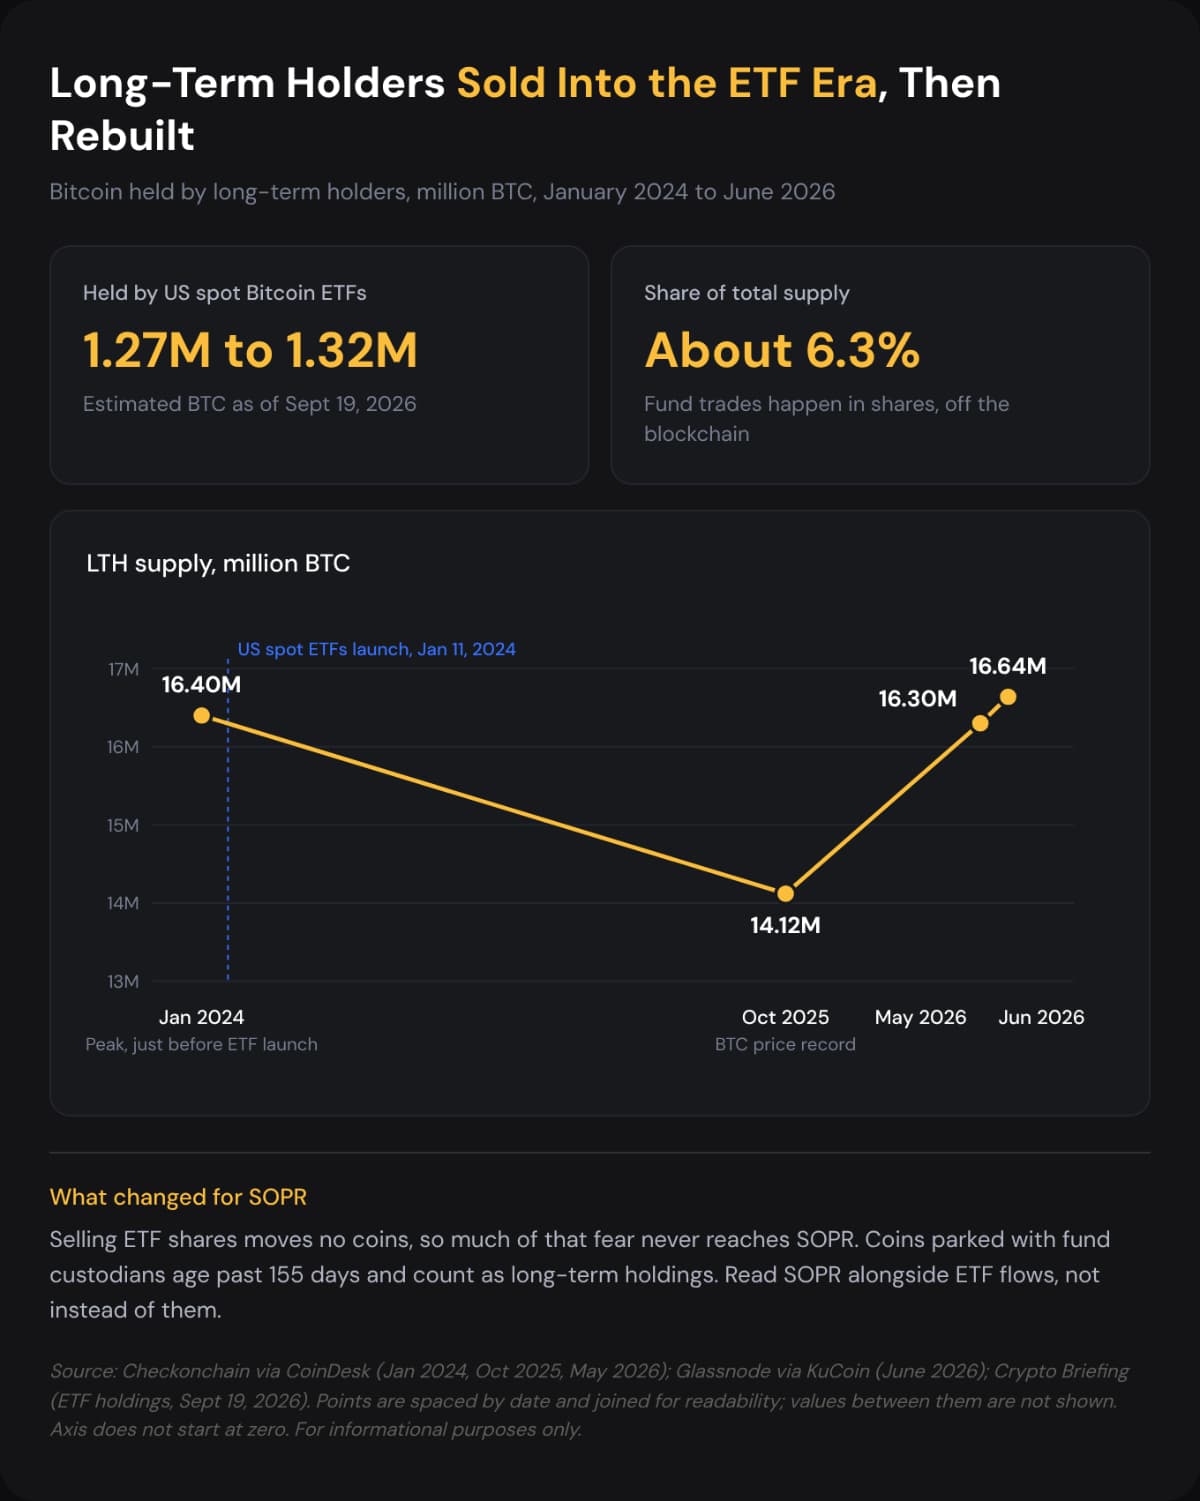
Source: Checkonchain via CoinDesk (January 2024 to May 2026). Glassnode via KuCoin (June 2026). ETF holdings via Crypto Briefing (19 September 2026).
SOPR still captures holders who keep coins on the blockchain, but it now misses a growing slice of the market. So ETF flows need to be read alongside SOPR.
The data shows SOPR just above 1, recent buyers near break-even, and long-term holders back in profit after half a year of losses. The pattern resembles early recoveries in past cycles, though Puell’s caution stands. SOPR describes the mood of sellers, not the next price, so it pays to watch a few signals together.
• STH-SOPR holding above 1. Repeated rejection at 1 would mean recent buyers are still using rallies to exit.
• The LTH 30-day average. A slide back below 1 would revive the bear market pattern.
• ETF flows. Daily fund flows show the selling that SOPR cannot see.
• The $83,000 to $86,000 zone. Glassnode flagged a cluster of long-term holder cost bases here, a level where break-even selling could appear.
An Indian investor also has a personal SOPR. Selling below cost carries no tax cushion here. Gains on VDAs (Virtual Digital Assets, the Indian legal term for crypto, tokens and NFTs) are taxed at a flat 30% plus 4% cess, a rule carried from Section 115BBH of the 1961 Act into the Income-tax Act, 2025 from 1 April 2026. A loss on one coin cannot reduce tax on a gain from another, and exchanges deduct 1% TDS (tax deducted at source, withheld automatically on each sale) above yearly limits. Unlike shares, a loss-making sale buys no relief on future gains.
Sources: Axel Adler Jr, Cointelegraph, CryptoQuant via KuCoin, XTB, Glassnode, CoinDesk, Crypto Briefing and ForkLog.
India Crypto Research operates independently. The information presented herein is intended solely for educational and informational purposes and should not be construed as financial advice. Before making any financial decisions, it's essential to undertake your own thorough research and analysis. If you're uncertain about any financial matters, we strongly recommend seeking guidance from an impartial financial advisor.


